

Rocket Companies Inc. stocks have been trading up by 3.05 percent following upbeat mortgage demand data and housing market optimism.
Key Takeaways
- Rocket Mortgage inside Rocket Companies is adopting VantageScore 4.0 as its preferred credit model for eligible GSE and VA loans, after tests showed more approvals and lower score costs.
- Multiple Wall Street shops cut price targets on RKT into the $15–$17 zone but kept positive ratings, citing resilient consumers against a backdrop of higher rates and weaker mortgage originations.
- Redfin, now under Rocket Companies, shows sellers outnumbering buyers by about 63%, the widest gap since 2013, signaling a thin but highly negotiable housing market.
- Data from RKT’s Redfin-powered brokerage shows 21% of U.S. home sellers cut asking prices in late September, with Denver and Texas seeing steep cuts while AI-driven San Francisco stays hot.
- Rocket Companies plans to report Q3 2026 earnings on 2026/10/29, setting up a key catalyst for traders tracking volumes, margins and the VantageScore rollout.
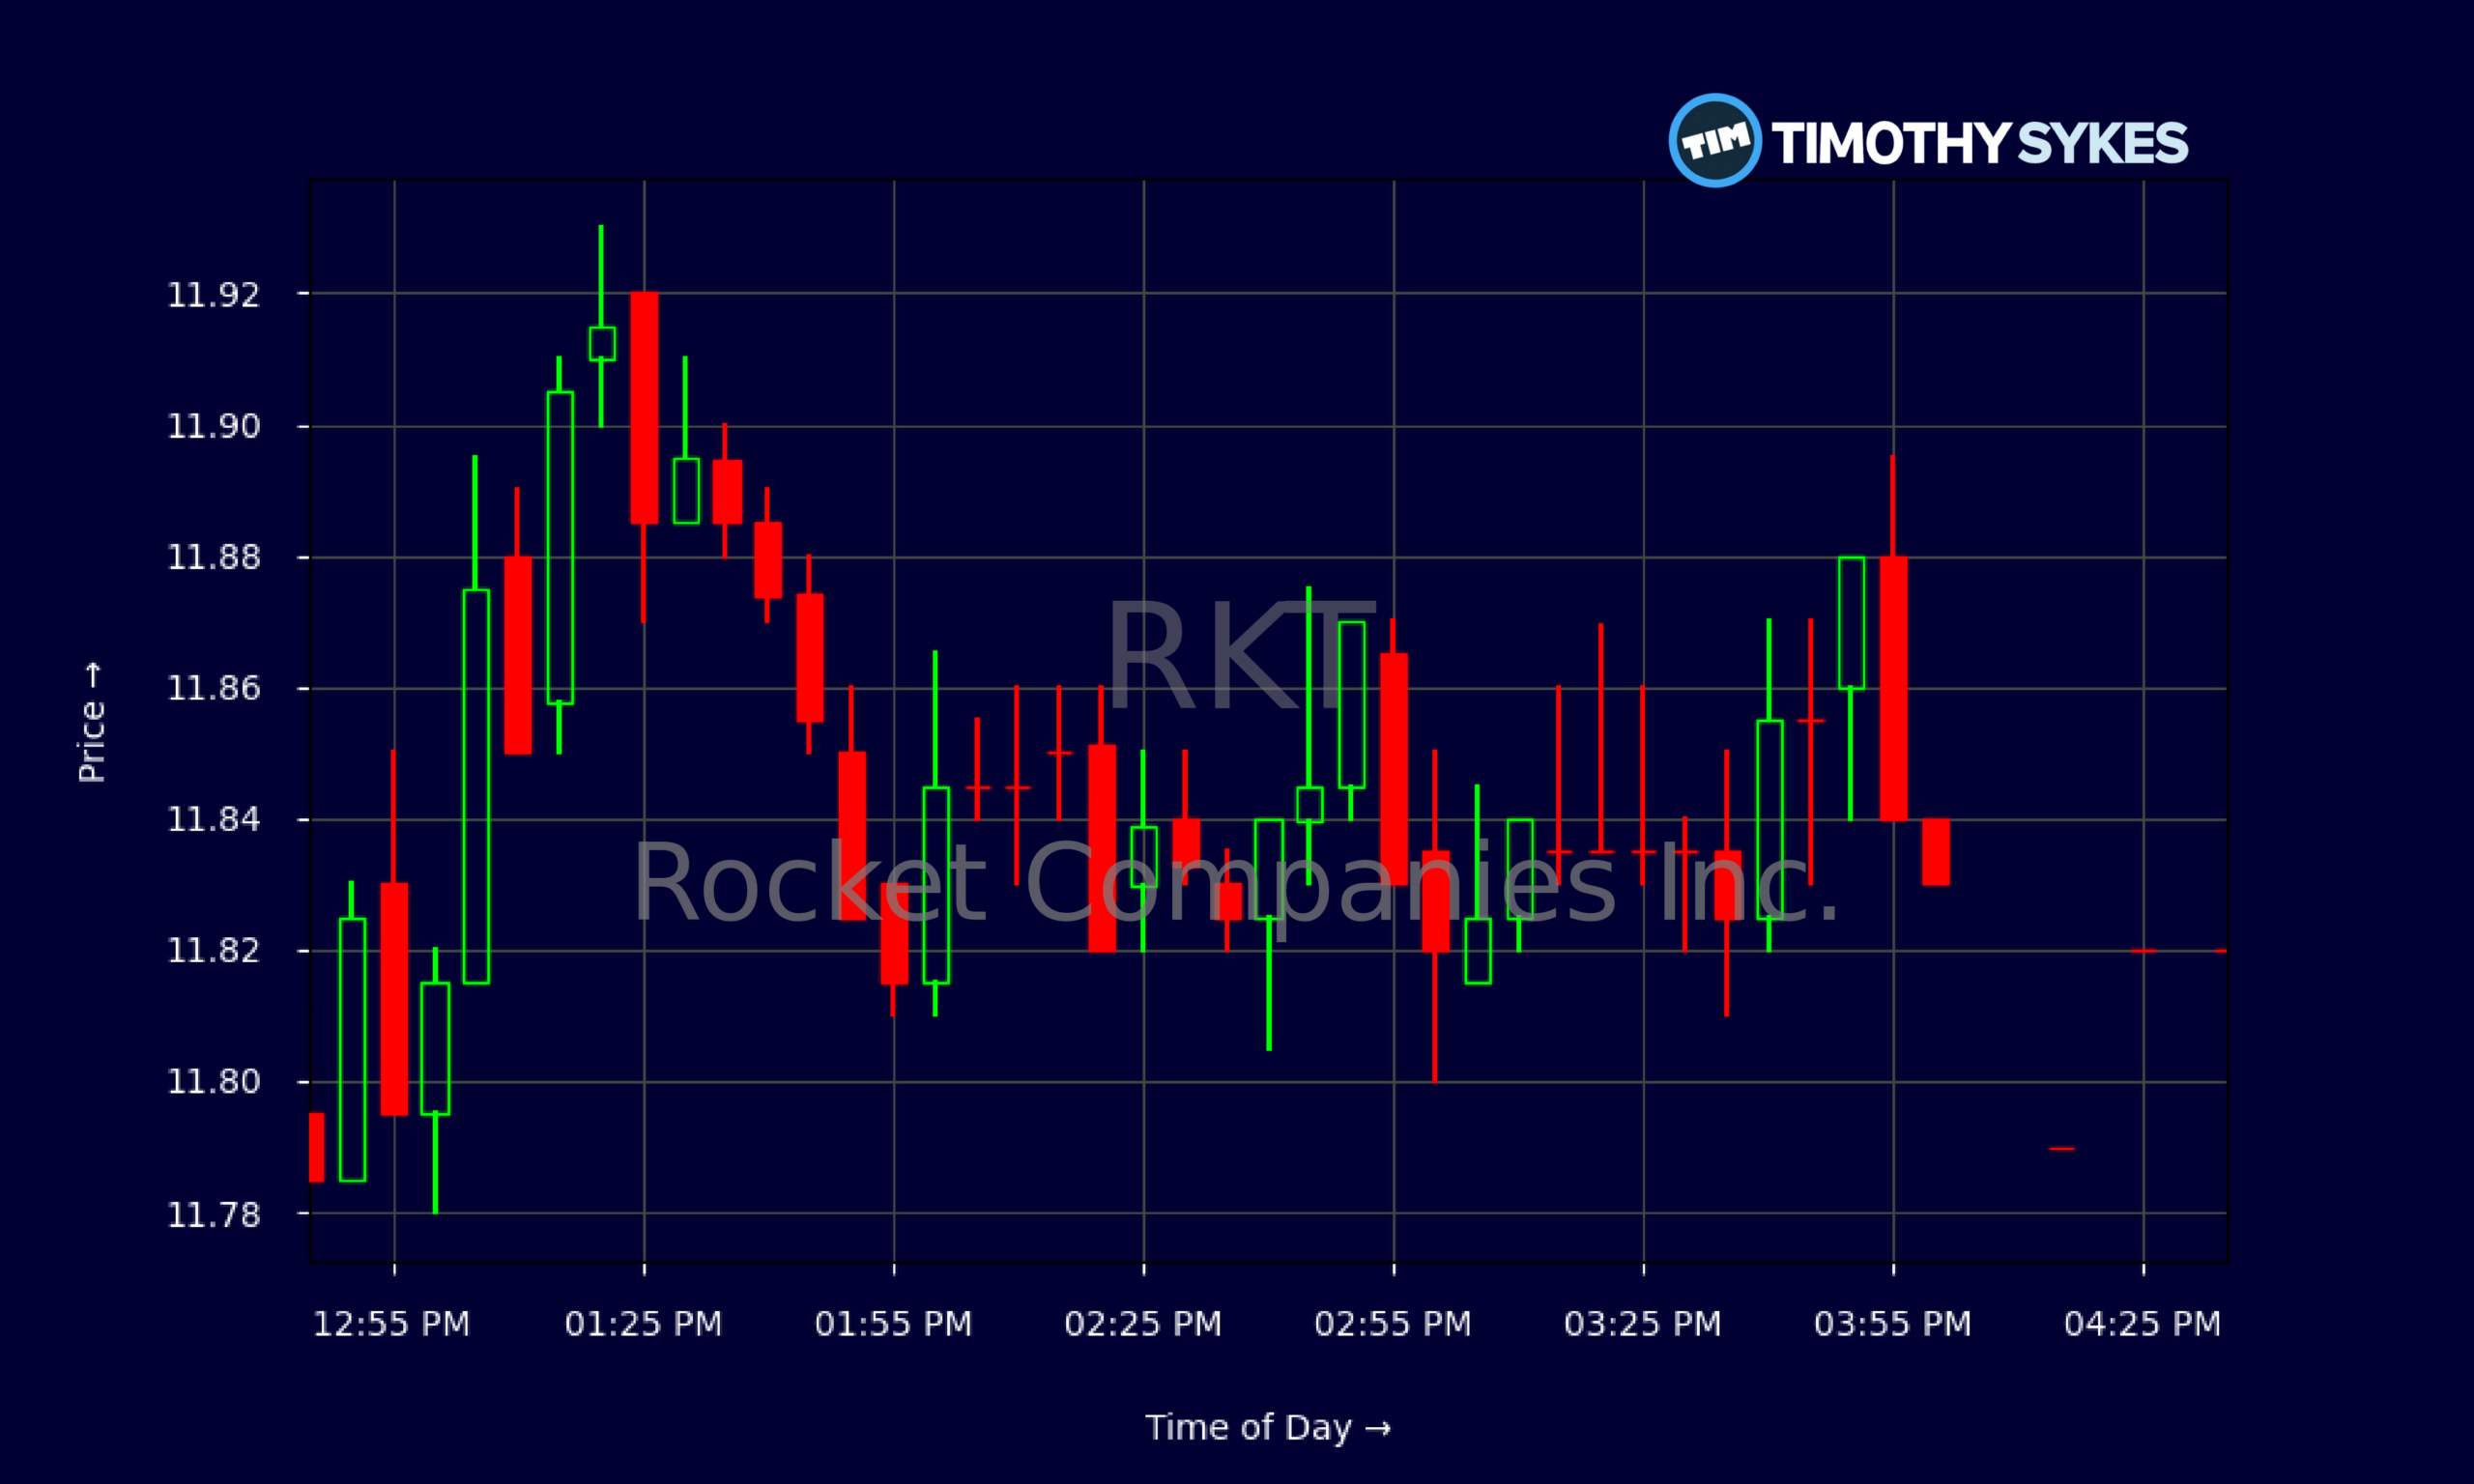
Live Update At 16:47:07 EDT: On Tuesday, October 27, 2026 Rocket Companies Inc. stock [NYSE: RKT] is trending up by 3.05%! Discover the key drivers behind this movement as well as our expert analysis in the detailed breakdown below.
Quick Financial Overview
RKT has been grinding higher in a choppy channel. From 2026/10/02 to 2026/10/27, Rocket Companies climbed from a close near $11.70 to about $11.84, with several shakeouts down toward $10.50 along the way. That tells traders this is not a clean trend move, but a tug-of-war range with dip buyers active below $11 and sellers leaning in around the low $12s.
Intraday, RKT’s 5‑minute tape shows tight consolidation between $11.75 and $11.90 into the close, with very little late‑day selling pressure. That kind of steady grind often signals accumulation rather than distribution. For short‑term trading, it sets up well‑defined risk around the $11.40–$11.50 support band carved out earlier in the session.
More Breaking News
Fundamentally, Rocket Companies just printed quarterly revenue of about $2.41B on annual revenue run‑rate near $6.26B, but the price/earnings ratio up around 52.2 tells you traders are already paying up for future growth, not current profits. Net margin near 5% and return on equity just above 3% show this is still a low‑return, capital‑heavy business, while leverage (long‑term debt around $27.4B versus equity near $23.5B) adds macro sensitivity. For RKT, that means the chart will move hard on any surprise around volumes, spreads, or funding costs.
Why Traders Are Watching RKT Now
RKT is suddenly at the center of two big storylines: a brutal housing backdrop and a bold credit-tech shift. Rocket Companies, through Rocket Mortgage, is set to become the first major U.S. lender to make VantageScore 4.0 its preferred credit model for eligible loans sold to Fannie Mae, Freddie Mac and the VA. Internal testing showed more borrowers qualify, many receive better pricing, and Rocket cuts its own scoring costs.
For traders, that is not just a PR headline. If RKT can approve more solid borrowers in a market where qualified demand is scarce, it can steal share without blowing up its risk profile. Management is keeping FICO on higher‑risk and non‑conforming products, which tells you this is a controlled experiment, not a free‑for‑all. Over time, wider funnels with lower per‑file costs can support margin per loan, even while headline origination volumes stay under pressure.
At the same time, Wall Street is dialing back the upside. Barclays, Morgan Stanley, Keefe Bruyette and StoneX all cut their RKT price targets into the $15–$17 band. Yet every one of them kept a positive stance — Overweight, Outperform, or Buy. That’s classic cautious optimism: analysts see resilient consumers and a still‑attractive lending model, but they respect the drag from high mortgage rates, sticky inflation and a softer housing market.
Redfin, now fully inside Rocket Companies, adds another lever. Its data shows home sellers outnumber buyers by roughly 63%, buyer demand is at record lows, and about 21% of sellers cut prices in late September. That screams “buyer’s market,” with Denver and Texas slashing, while an AI‑driven San Francisco stays hot. For RKT, that granular view can drive smarter marketing and pricing — knowing exactly where motivated sellers and rare qualified buyers still meet.
Conclusion
For active traders, RKT is a classic battleground between macro headwinds and company‑specific execution. The macro side is ugly: mortgage rates above 7%, listings at the highest level since 2020, and buyer demand near record lows. Redfin data under the Rocket Companies umbrella confirms it — plenty of homes, not enough willing or able buyers, and aggressive price cuts in key metros.
On the other side, RKT is not standing still. The VantageScore 4.0 rollout across Rocket Mortgage’s direct‑to‑consumer channel shows a willingness to rip up old workflows if the numbers say it helps approvals and unit economics. The Redfin acquisition gives Rocket Companies a real data moat and a national stage on affordability and housing‑cycle research. Add in upcoming Q3 2026 earnings on 2026/10/29, and traders have a clear catalyst where management will need to back up the story with hard numbers on revenue, spreads and costs.
The sell side’s trimmed but still‑bullish targets frame the trade: expectations are no longer extreme, but RKT is not priced as a disaster either. In this kind of setup, process matters more than prediction. As Tim Sykes pounds into his students, “Cut losses quickly, that’s the only way to survive long term in this crazy market.” As millionaire penny stock trader and teacher Tim Sykes, says, “It’s better to go home at zero than to go home in the red.”. For Rocket Companies and for RKT traders, the edge comes from respecting that rule, watching the $11 support and $12 resistance, and letting the next earnings and housing data decide the next big move.
This is stock news, not investment advice. Timothy Sykes News delivers real-time stock market news focused on key catalysts driving short-term price movements. Our content is tailored for active traders and investors seeking to capitalize on rapid price fluctuations, particularly in volatile sectors like penny stocks. Readers come to us for detailed coverage on earnings reports, mergers, FDA approvals, new contracts, and unusual trading volumes that can trigger significant short-term price action. Some users utilize our news to explain sudden stock movements, while others rely on it for diligent research into potential investment opportunities.
Dive deeper into the world of trading with Timothy Sykes, renowned for his expertise in penny stocks. Explore his top picks and discover the strategies that have propelled him to success with these articles:
- Penny Stocks Trading Guide
- Best Penny Stocks Under $1 to Buy Today
- Top 8 Penny Stocks to Watch on Robinhood
Once you’ve got some stocks on watch, elevate your trading game with StocksToTrade the ultimate platform for traders. With specialized tools for swing and day trading, StocksToTrade will guide you through the market’s twists and turns.
Dig into StocksToTrade’s watchlists here:





Leave a reply