

Amazon.com Inc. stocks have been trading down by -2.18 percent amid heightened concern over regulatory risks and slowing e-commerce growth.
Key Takeaways For AMZN Traders
- Truist projects that Microsoft’s major AI and cloud peers will run negative free cash flow under heavy AI infrastructure spending, implicitly positioning them as financially weaker than Microsoft in the current AI investment cycle.
- Oppenheimer notes that Walmart’s new combined membership improves its membership value proposition versus Amazon Prime, potentially aiding Walmart’s share gains in delivery and e-commerce and marginally pressuring Amazon’s competitive position at the value end of the market.
- AliExpress’s new Elite VIP program for high-spending customers in Europe and other markets represents a small but targeted competitive move against entrenched e-commerce players like Amazon.
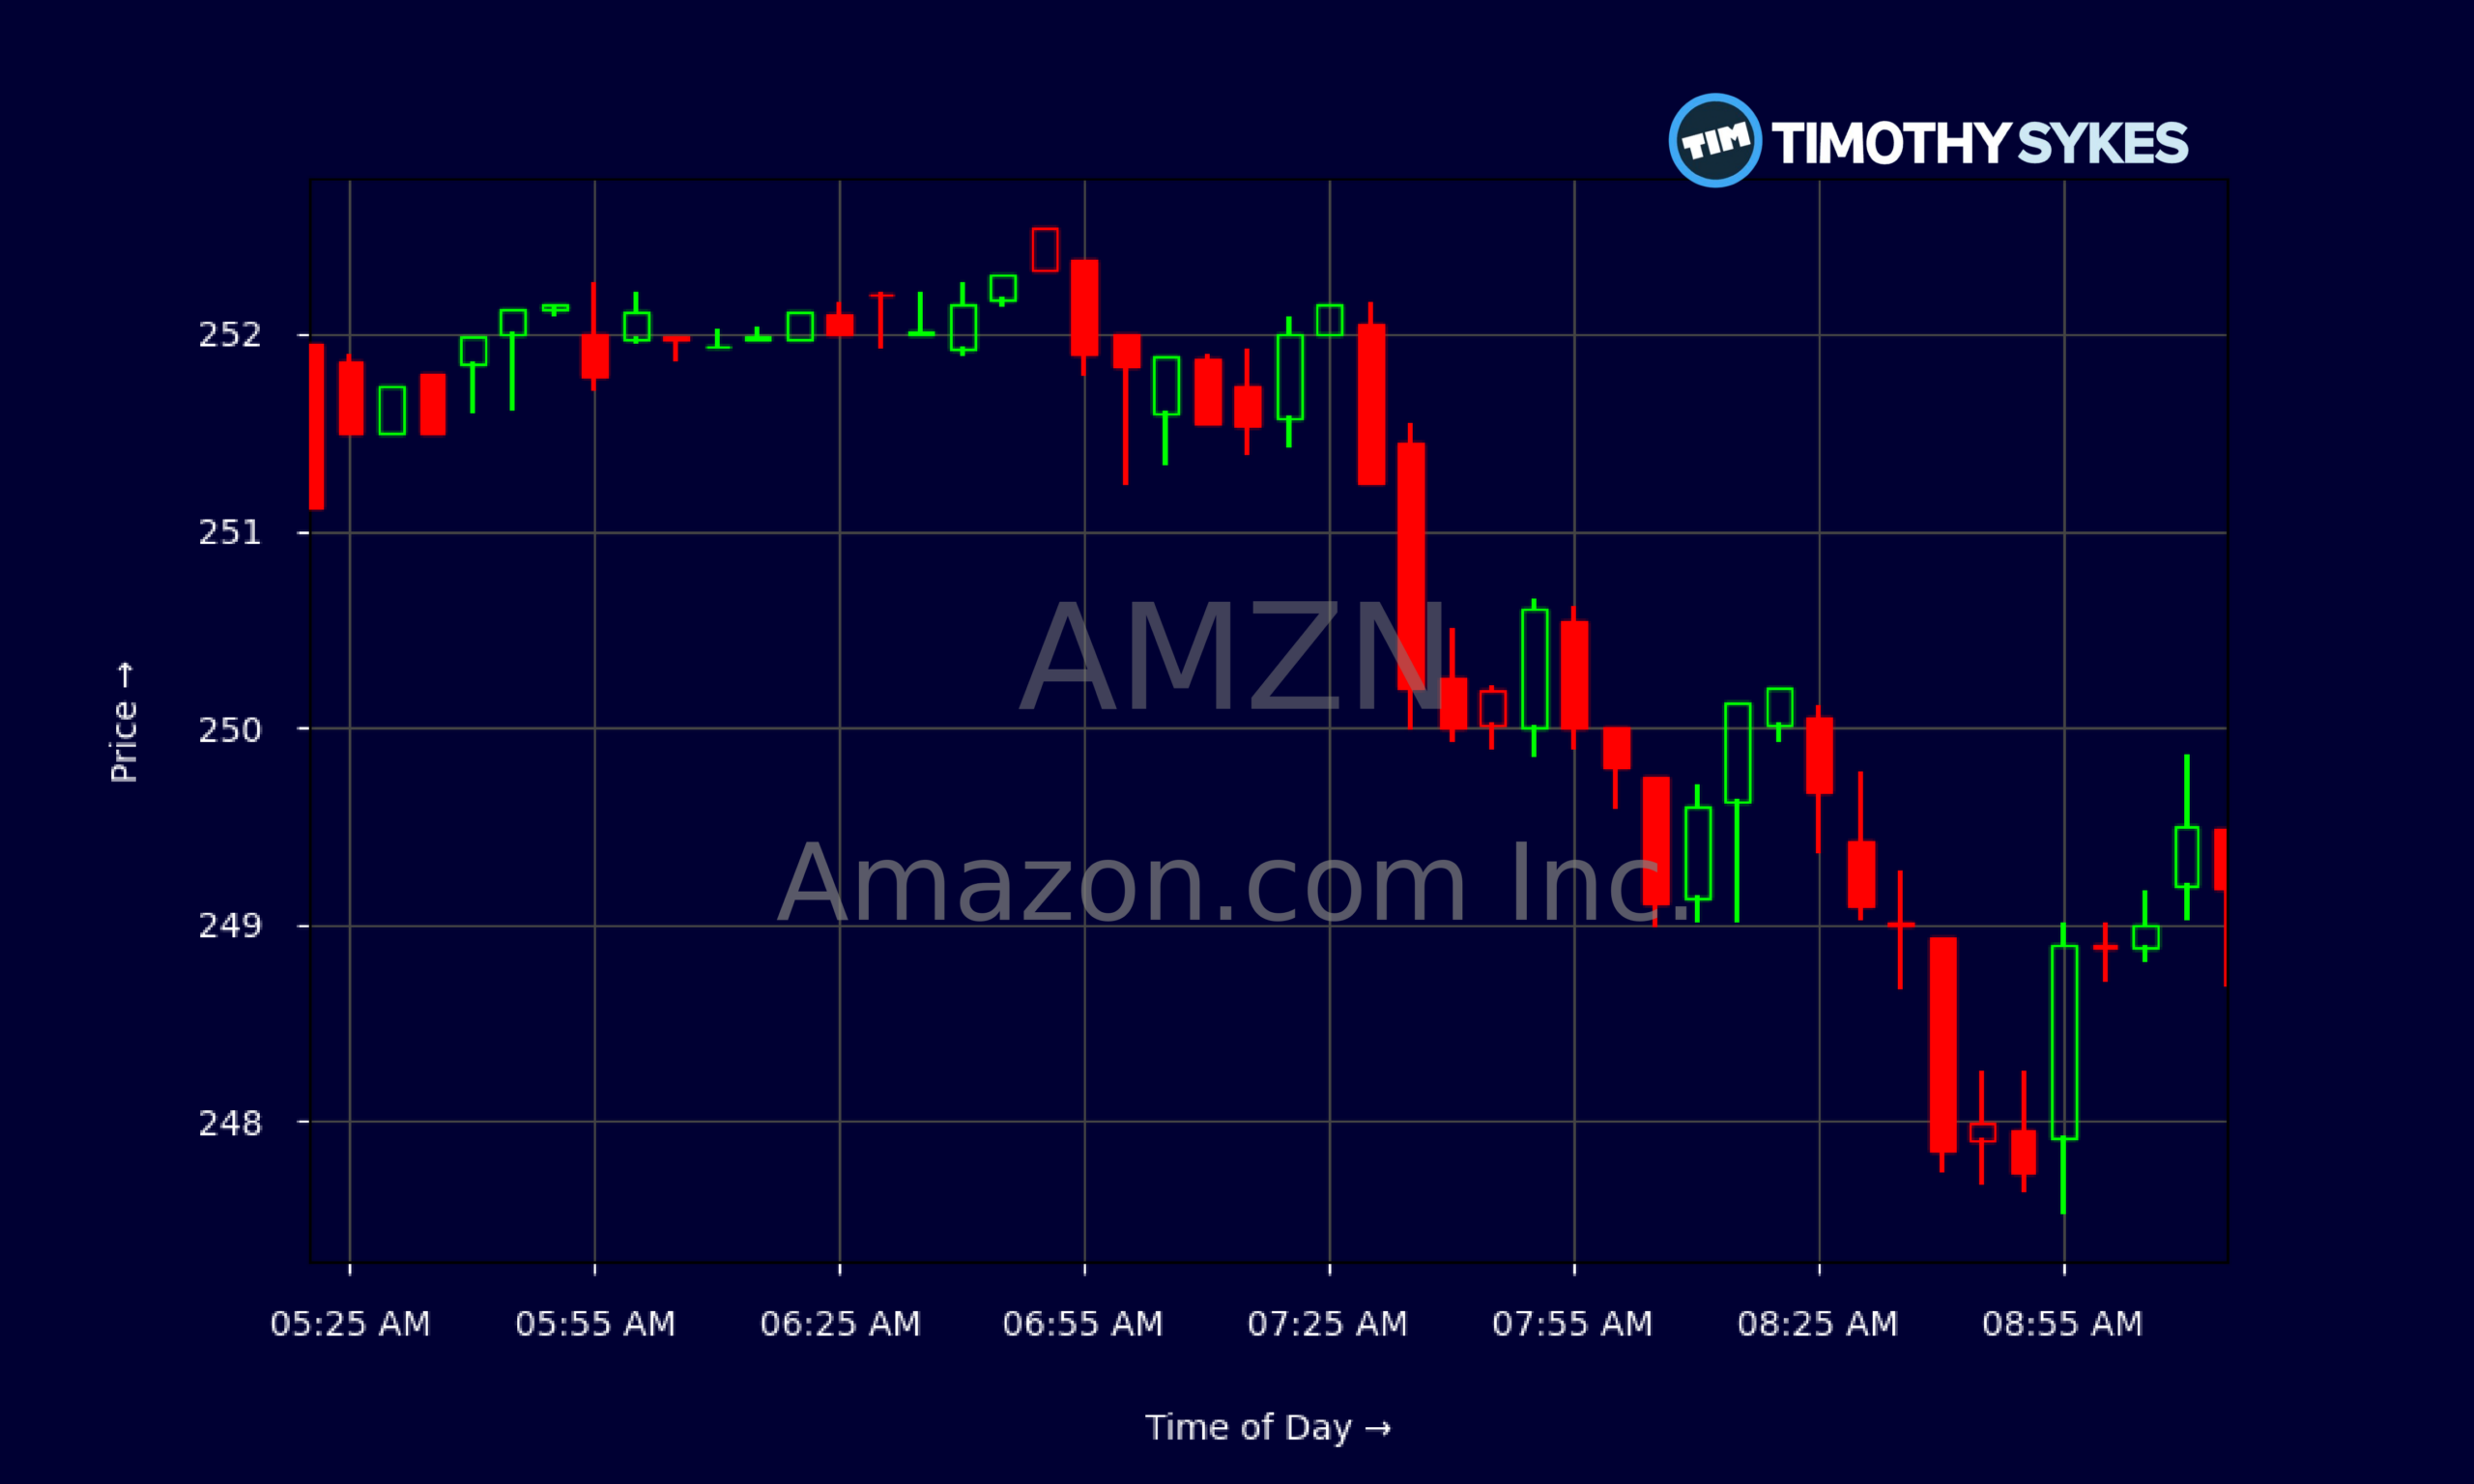
Live Update At 09:18:33 EDT: On Thursday, October 29, 2026 Amazon.com Inc. stock [NASDAQ: AMZN] is trending down by -2.18%! Discover the key drivers behind this movement as well as our expert analysis in the detailed breakdown below.
Quick Financial Overview
AMZN is climbing a slow but steady staircase on the chart. Over the past couple of weeks, Amazon.com Inc. has traded mostly between $250 and $265, with recent closes around $254–$255, showing a mild pullback from local highs near $265. That range tells traders AMZN is consolidating after a strong run, not collapsing.
Intraday, AMZN’s 5‑minute candles show tight trading around $252–$252.5 in the premarket, with shallow dips getting bought. That kind of tape usually signals active dip-buying and strong liquidity. Volatility is present but controlled, which matters for day traders looking for clean risk levels.
Under the hood, AMZN’s fundamentals still look powerful. Revenue sits near $716.9B annually, with a fat 50.8% gross margin and EBIT margin around 23%. Return on equity above 30% and return on capital near the mid‑20s show Amazon.com Inc. is squeezing real profits from its scale.
More Breaking News
Debt does not look dangerous here. A total‑debt‑to‑equity ratio of 0.23, strong interest coverage above 70, and a current ratio around 1 suggest AMZN can fund its AI and logistics ambitions without blowing up the balance sheet—at least for now.
Why Traders Are Watching AMZN’s Competitive Pressure
The real story for AMZN traders today is not a single headline move, but a slow tightening of the competitive screws around Amazon.com Inc.’s core engines: AI cloud, Prime, and global e‑commerce. None of these new threats are fatal on their own. Together, they shape how the next big trend in AMZN will break.
On the AI side, Truist is waving a caution flag. Their call that Microsoft’s major AI and cloud peers will push into negative free cash flow under heavy AI infrastructure spending hits right where AMZN is spending big through Amazon Web Services. If Microsoft is seen as the cash‑flow tank in this arms race, traders may assume AMZN has a thinner buffer as it builds data centers and buys chips at scale. That perception alone can cap upside when sentiment turns defensive.
In retail, Oppenheimer highlights Walmart’s new combined membership as a stronger rival to Amazon Prime. For years, AMZN used Prime as a sticky moat—fast shipping, bundled services, and a huge product catalog. Now Walmart is sharpening its own membership offer, especially at the value end of the market. For cost‑sensitive households, even a small edge in perceived value can shift share away from Amazon.com Inc. over time.
Add AliExpress into the mix. Its Elite VIP program for big‑spending customers in Europe and other markets looks niche today, but it targets precisely the high‑value shoppers AMZN wants in those regions. It is another reminder that global e‑commerce is turning into a loyalty war, where perks and segmentation matter as much as price.
For active traders, that backdrop means AMZN rallies into resistance around the mid‑$260s may fade faster if any of these competitive pressures show up in growth metrics or margin commentary.
Conclusion
AMZN sits at an awkward crossroads. On one hand, the numbers from Amazon.com Inc. are strong: over $200.6B in quarterly revenue, more than $104.8B in gross profit, and EBITDA above $102B show a machine that still prints serious cash. Operating income of $27.5B and net income of $62.6B for the reported period back that up. For swing traders, those metrics justify why dip‑buyers keep defending the $250 zone on the chart.
On the other hand, the news flow is quietly leaning against AMZN. Truist’s view on AI spending raises the bar for AWS to prove its cash discipline next cycle. Oppenheimer’s call on Walmart’s membership upgrade pokes at the Prime moat, especially on value. AliExpress’s Elite VIP move chips away at international loyalty around the edges. None of this breaks Amazon.com Inc. today, but it narrows the margin of error.
In this kind of tape, traders in AMZN should treat every breakout attempt with a skeptical eye and clear risk levels. Watch how price behaves near recent highs and how fast buyers step in on any pullback toward $250. Competitive shocks can turn slow‑grinding consolidations into sharp re‑ratings. As millionaire penny stock trader and teacher Tim Sykes, says, “Consistency is key in trading; don’t let emotions dictate your trades.” That mindset matters when AMZN whipsaws around key levels, because sticking to a rules‑based plan can be the difference between a controlled loss and an emotional spiral after a sharp move.
Tim Sykes likes to remind traders, “The market doesn’t care about your opinion, only your preparation.” For AMZN, preparation means knowing the numbers, tracking these competitive shots across AI and retail, and being ready to cut losses fast if the story breaks against you. This analysis is for educational and research purposes only, not investment advice.
This is stock news, not investment advice. Timothy Sykes News delivers real-time stock market news focused on key catalysts driving short-term price movements. Our content is tailored for active traders and investors seeking to capitalize on rapid price fluctuations, particularly in volatile sectors like penny stocks. Readers come to us for detailed coverage on earnings reports, mergers, FDA approvals, new contracts, and unusual trading volumes that can trigger significant short-term price action. Some users utilize our news to explain sudden stock movements, while others rely on it for diligent research into potential investment opportunities.
Dive deeper into the world of trading with Timothy Sykes, renowned for his expertise in penny stocks. Explore his top picks and discover the strategies that have propelled him to success with these articles:
- Penny Stocks Trading Guide
- Best Penny Stocks Under $1 to Buy Today
- Top 8 Penny Stocks to Watch on Robinhood
Once you’ve got some stocks on watch, elevate your trading game with StocksToTrade the ultimate platform for traders. With specialized tools for swing and day trading, StocksToTrade will guide you through the market’s twists and turns.
Dig into StocksToTrade’s watchlists here:





Leave a reply