

Alphabet Inc. faces selling pressure as regulatory antitrust scrutiny intensifies, and its stocks have been trading down by -11.05 percent.
Key Takeaways
- Q3 EPS came in at $2.12 versus $3.02 expected, a sharp miss that rattled traders focused on GOOGL’s earnings power.
- Core Search & Other revenue of $63.4B and YouTube Ads at $11.2B both landed below Street targets, flagging softness in key engines.
- Truist warns Microsoft’s major AI peers may run negative free cash flow as AI capex ramps, a cautionary backdrop for GOOGL’s spending plans.
- DOJ ad‑tech remedies threaten Google Ad Exchange’s win rate and could shift ad dollars toward rivals like Magnite.
- A fresh securities class action targets Alphabet’s disclosures on growth and stability, adding legal and headline risk to GOOGL trading.
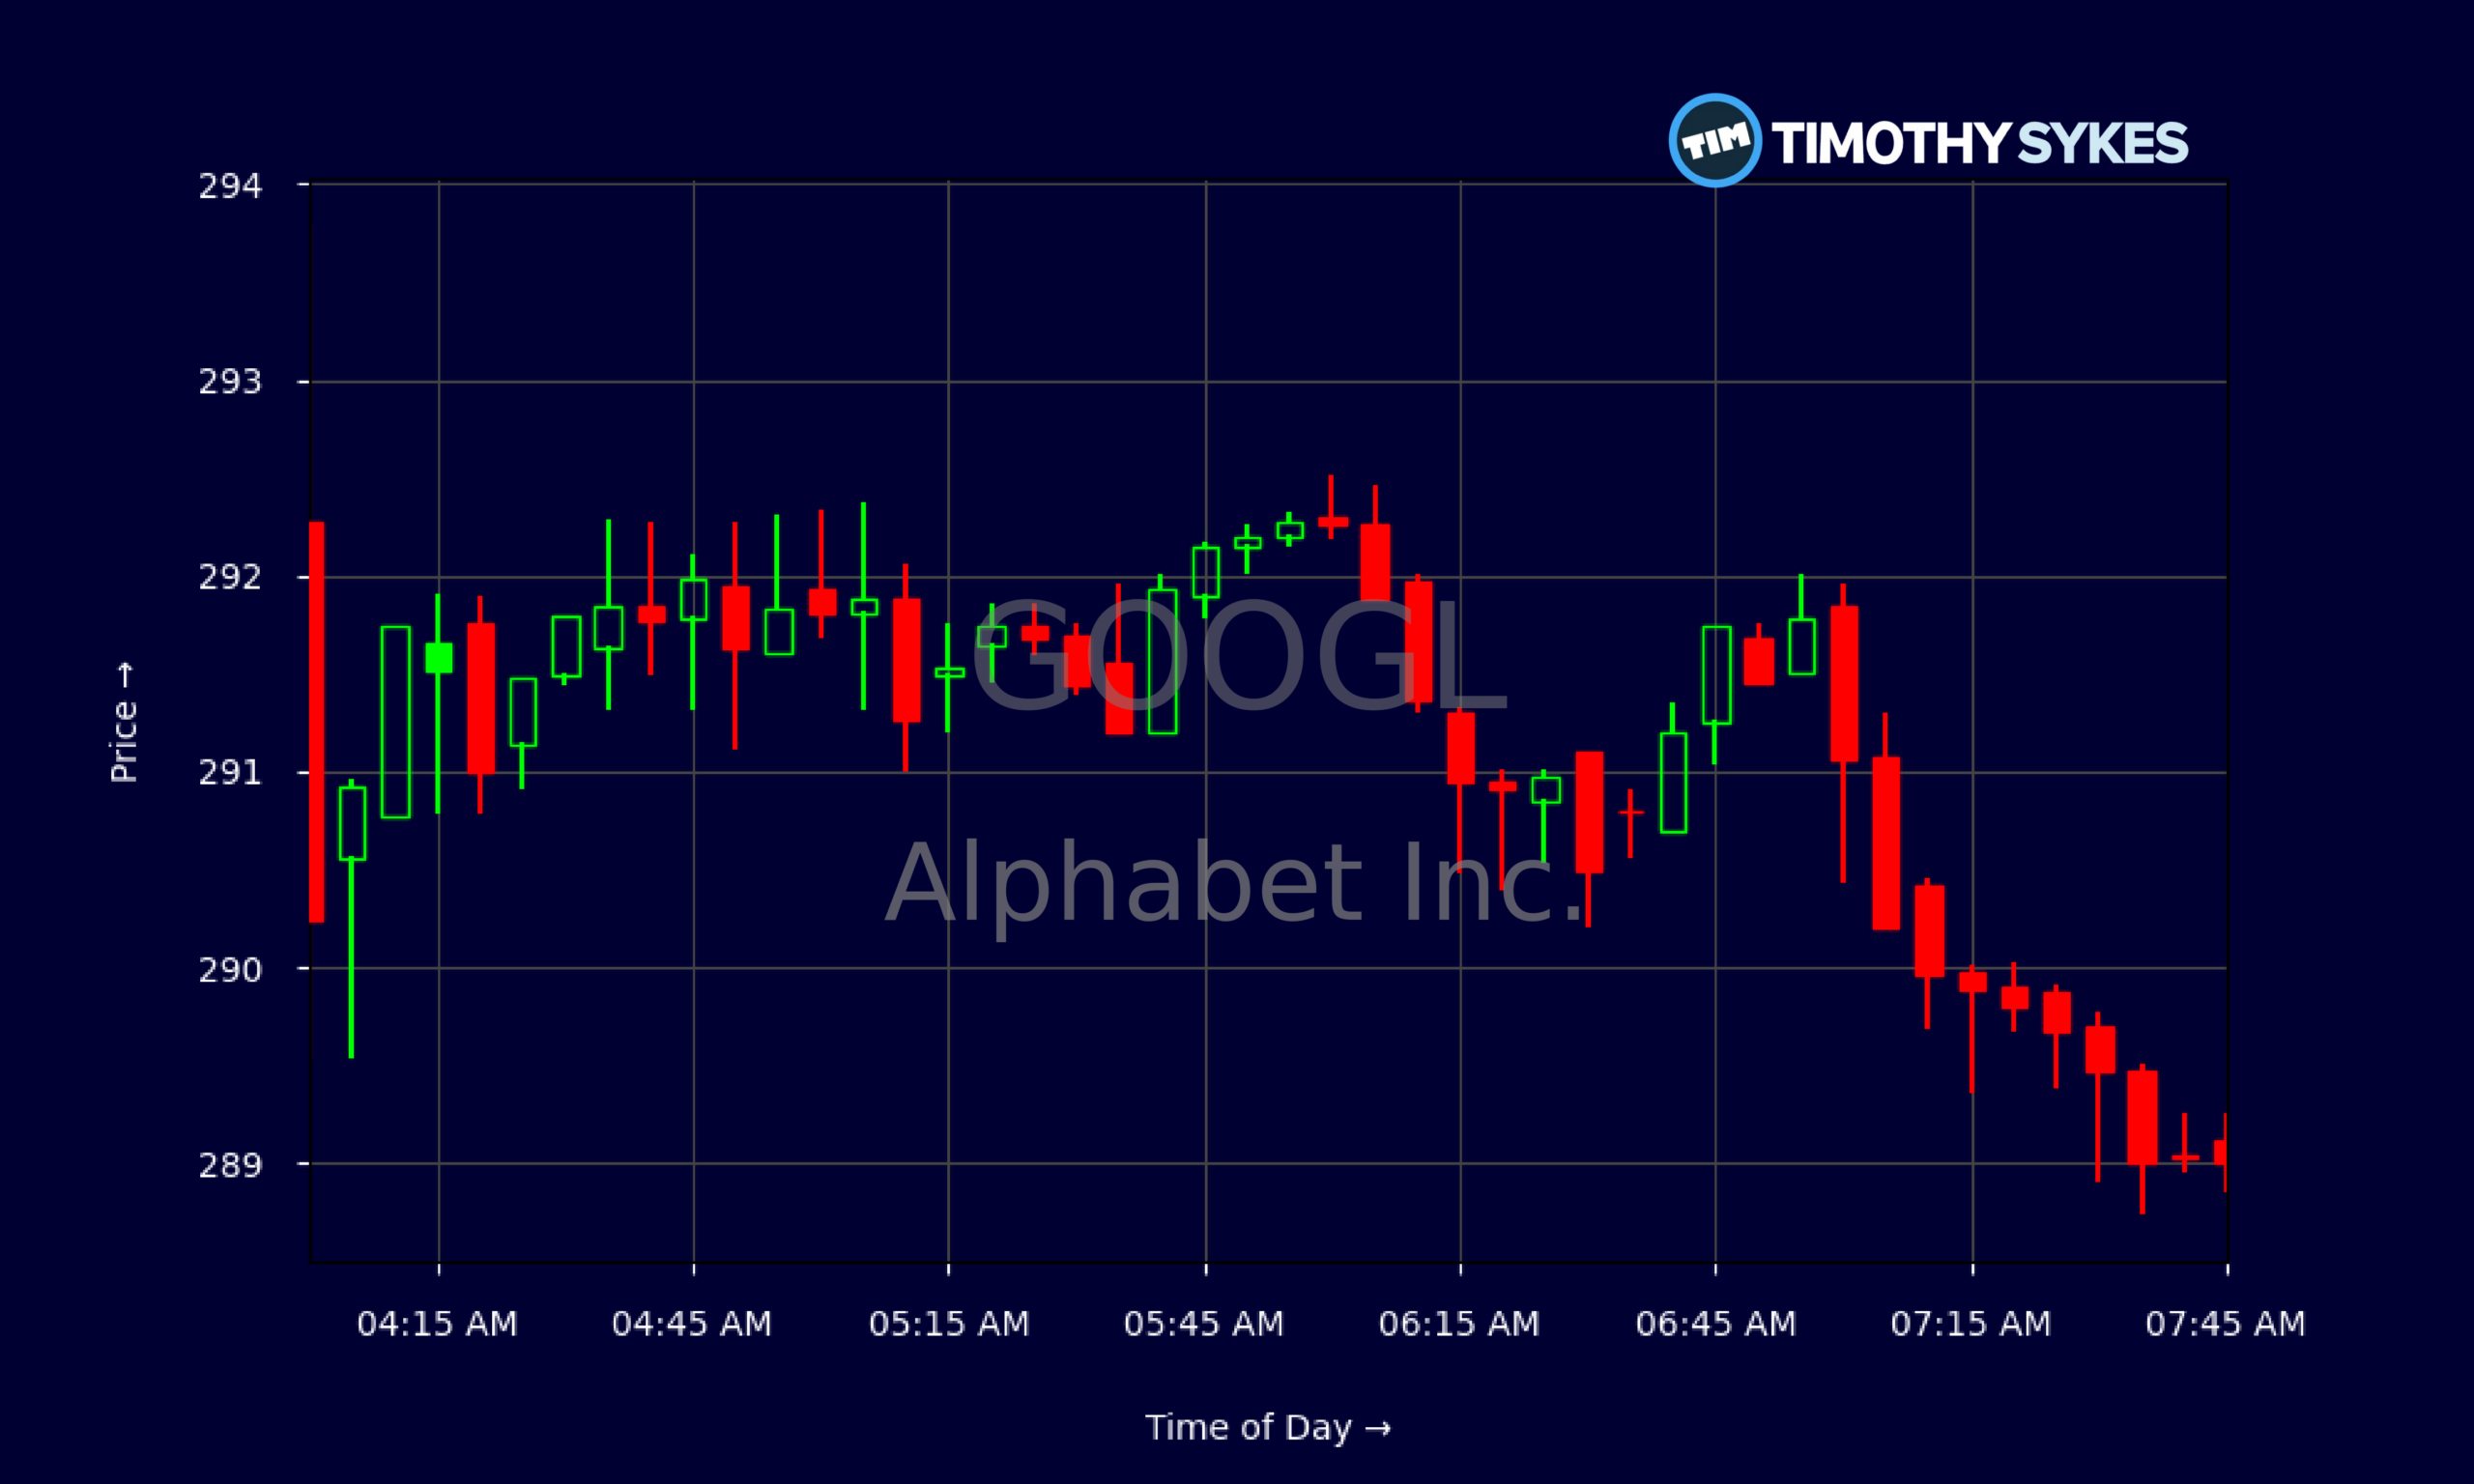
Live Update At 07:48:01 EDT: On Thursday, October 29, 2026 Alphabet Inc. stock [NASDAQ: GOOGL] is trending down by -11.05%! Discover the key drivers behind this movement as well as our expert analysis in the detailed breakdown below.
Quick Financial Overview
GOOGL is showing traders a split personality right now. On one hand, Alphabet’s fundamental machine still looks massive and profitable. The company booked $119.8B in quarterly revenue and sports fat margins, with EBIT margin above 55% and gross margin near 81.5%. Return on equity above 30% and a light debt load signal a still‑elite franchise with room to maneuver.
On the other hand, the latest tape and cash flow trends are telling a different short‑term story. Multi‑day prices show GOOGL sliding from the mid‑$350s down toward the low $320s, a clear downtrend into the Q3 earnings release on 2026/10/28. That’s a break in momentum after a strong run, and traders should respect it.
Cash flow is another pressure point. Despite $39.1B in operating cash flow last quarter, heavy capex and AI‑era spending pushed free cash flow to roughly -$5.9B. For an Alphabet‑sized name, that flip to negative free cash flow grabs serious attention. It tells traders that the AI arms race is not free — and that every earnings report now has to justify that spend.
More Breaking News
Intraday, the 5‑minute chart shows GOOGL grinding lower from the low $290s, with tight ranges and fading bounces, classic distribution price action as bigger players trim exposure into weakness.
Why Traders Are Watching GOOGL Now
GOOGL is back in the ring, and this time the punches are landing. Alphabet’s Q3 numbers on 2026/10/28 shook a market that had priced in smooth execution. EPS of $2.12 versus the $3.02 FactSet consensus is not a minor wobble; it’s a full‑on reset of earnings expectations. For traders, that kind of miss often rewrites the playbook on where the stock can trade in the near term.
The problem isn’t just the bottom line. GOOGL’s core engines — Search & Other and YouTube Ads — also came in light. Search & Other revenue printed $63.4B against a $65B consensus, while YouTube Ads landed at $11.2B versus $11.4B expected. When the supposedly bulletproof ad machine underperforms, traders start asking if digital ad demand is slowing, if TikTok and other platforms are nibbling at the edges, or if pricing power is slipping.
Layer on the macro theme coming from Truist: Microsoft’s big AI and cloud peers are expected to run negative free cash flow as they pour money into AI infrastructure. That paints a tough backdrop for GOOGL. Alphabet is in that same high‑spend AI race, yet Microsoft is being framed as the financially stronger name. That relative perception matters — in shaky tape, traders often rotate toward the perceived fortress and away from anything showing cracks.
Regulatory heat adds another overhang. DOJ ad‑tech remedies aimed at neutral auctions threaten to cut Google Ad Exchange’s win rate and redirect ad spend toward rivals like Magnite. That’s not a short‑term chart pattern; it’s structural risk to a rich, high‑margin profit pool. At the same time, Brussels is working on a new lump‑sum EU corporate levy targeting giants like Alphabet with over EUR 100M in regional revenue. More tax, more pressure on EPS, more reasons for traders to demand a discount multiple on GOOGL.
Finally, the new securities class action alleging misleading statements around business strength between 2026/05/19 and 2026/07/16 adds a legal headline cloud. Even if the outcome is uncertain, the suit feeds into a broader narrative of shaken confidence just as GOOGL’s numbers wobble.
Conclusion
For active traders, GOOGL has shifted from quiet mega‑cap to active battleground. The stock still rests on huge revenue, thick margins, and a strong balance sheet, but the Q3 earnings miss, negative free cash flow, and soft ad metrics are forcing the market to re‑price the story. That’s why the chart has rolled over from the mid‑$350s to the low $320s and why each bounce now needs to prove itself.
Regulatory and legal risks only sharpen that edge. DOJ ad‑tech remedies, a potential new EU corporate levy, and a securities class action together form a steady drip of uncertainty that caps how aggressive many traders want to be on GOOGL’s upside in the short term. None of these headlines destroy Alphabet’s long‑term business, but they do compress the margin for error on every earnings print and every guidance comment.
This is exactly the kind of setup Tim Sykes and his community focus on: big liquid names with sudden narrative shifts and clean technical levels. As Tim likes to say, “The market doesn’t care about your opinion, it cares about price action — your job is to react, not predict.” As millionaire penny stock trader and teacher Tim Sykes, says, “The goal is not to win every trade but to protect your capital and keep moving forward.”. For GOOGL, that means respecting the downtrend, watching how the stock behaves around recent lows and prior support, and being ready to cut losses fast if the earnings and regulatory storm lasts longer than the crowd expects.
This analysis is for educational and research purposes only and is not investment advice.
This is stock news, not investment advice. Timothy Sykes News delivers real-time stock market news focused on key catalysts driving short-term price movements. Our content is tailored for active traders and investors seeking to capitalize on rapid price fluctuations, particularly in volatile sectors like penny stocks. Readers come to us for detailed coverage on earnings reports, mergers, FDA approvals, new contracts, and unusual trading volumes that can trigger significant short-term price action. Some users utilize our news to explain sudden stock movements, while others rely on it for diligent research into potential investment opportunities.
Dive deeper into the world of trading with Timothy Sykes, renowned for his expertise in penny stocks. Explore his top picks and discover the strategies that have propelled him to success with these articles:
- Penny Stocks Trading Guide
- Best Penny Stocks Under $1 to Buy Today
- Top 8 Penny Stocks to Watch on Robinhood
Once you’ve got some stocks on watch, elevate your trading game with StocksToTrade the ultimate platform for traders. With specialized tools for swing and day trading, StocksToTrade will guide you through the market’s twists and turns.
Dig into StocksToTrade’s watchlists here:





Leave a reply