timothy sykes logo

Patterns To Watch

A Totally Unconventional Pattern

Timothy SykesAvatar
Written by Timothy Sykes
Updated 9/4/2022 4 min read

No one takes a road trip without directions or, at the very least, a map.

But that’s what you do when you trade without a chart pattern.

Chart patterns are the very foundation of what I teach and how I, and many of my millionaire students, trade.

By now, most of you have heard about my #1 pattern – Supernovas.

This was the first pattern I came across that totally changed my life.

Now, I want to let you in on a little secret.

Chart patterns are about more than just visuals. It’s about the narrative they tell.

When I look at a chart pattern, I don’t just see numbers. I see a novel written about the transactions between buyers and sellers.

One of my top millionaire students, Mark Crook, did an excellent review of BrightMinds Biosciences Inc. (NASDAQ: DRUG) for my challenge students.

Normally, I’d keep this material exclusive to them.

However, Mark’s analysis was so spot on that I just had to share it with you.

I’ll explain his trade and, more importantly, WHY he took it.

Do You Supernova?

high frequency trading
© Millionaire Media, LLC

At the start of 2022, many of the Supernovas flamed out the same day they spiked.

In July, that changed as we saw more and more multi-day runners.

However, as I mentioned in one of my previous newsletters, I expect the bullishness to die off towards the end of the month.

My 7-step penny stock framework, which you can read about here, lists the various phases of the pattern.

As Mark pointed out, within that framework, most people probably expected the stock to fall into #7, the long kiss goodnight, after the second spike that made a lower high (#6).

Normally, a stock gets to that point and fades into oblivion with some bounces here and there along the way.

Those small bounces are great plays for dip buys.

However, this stock did something very different.

You see, normally, stocks do something like this…

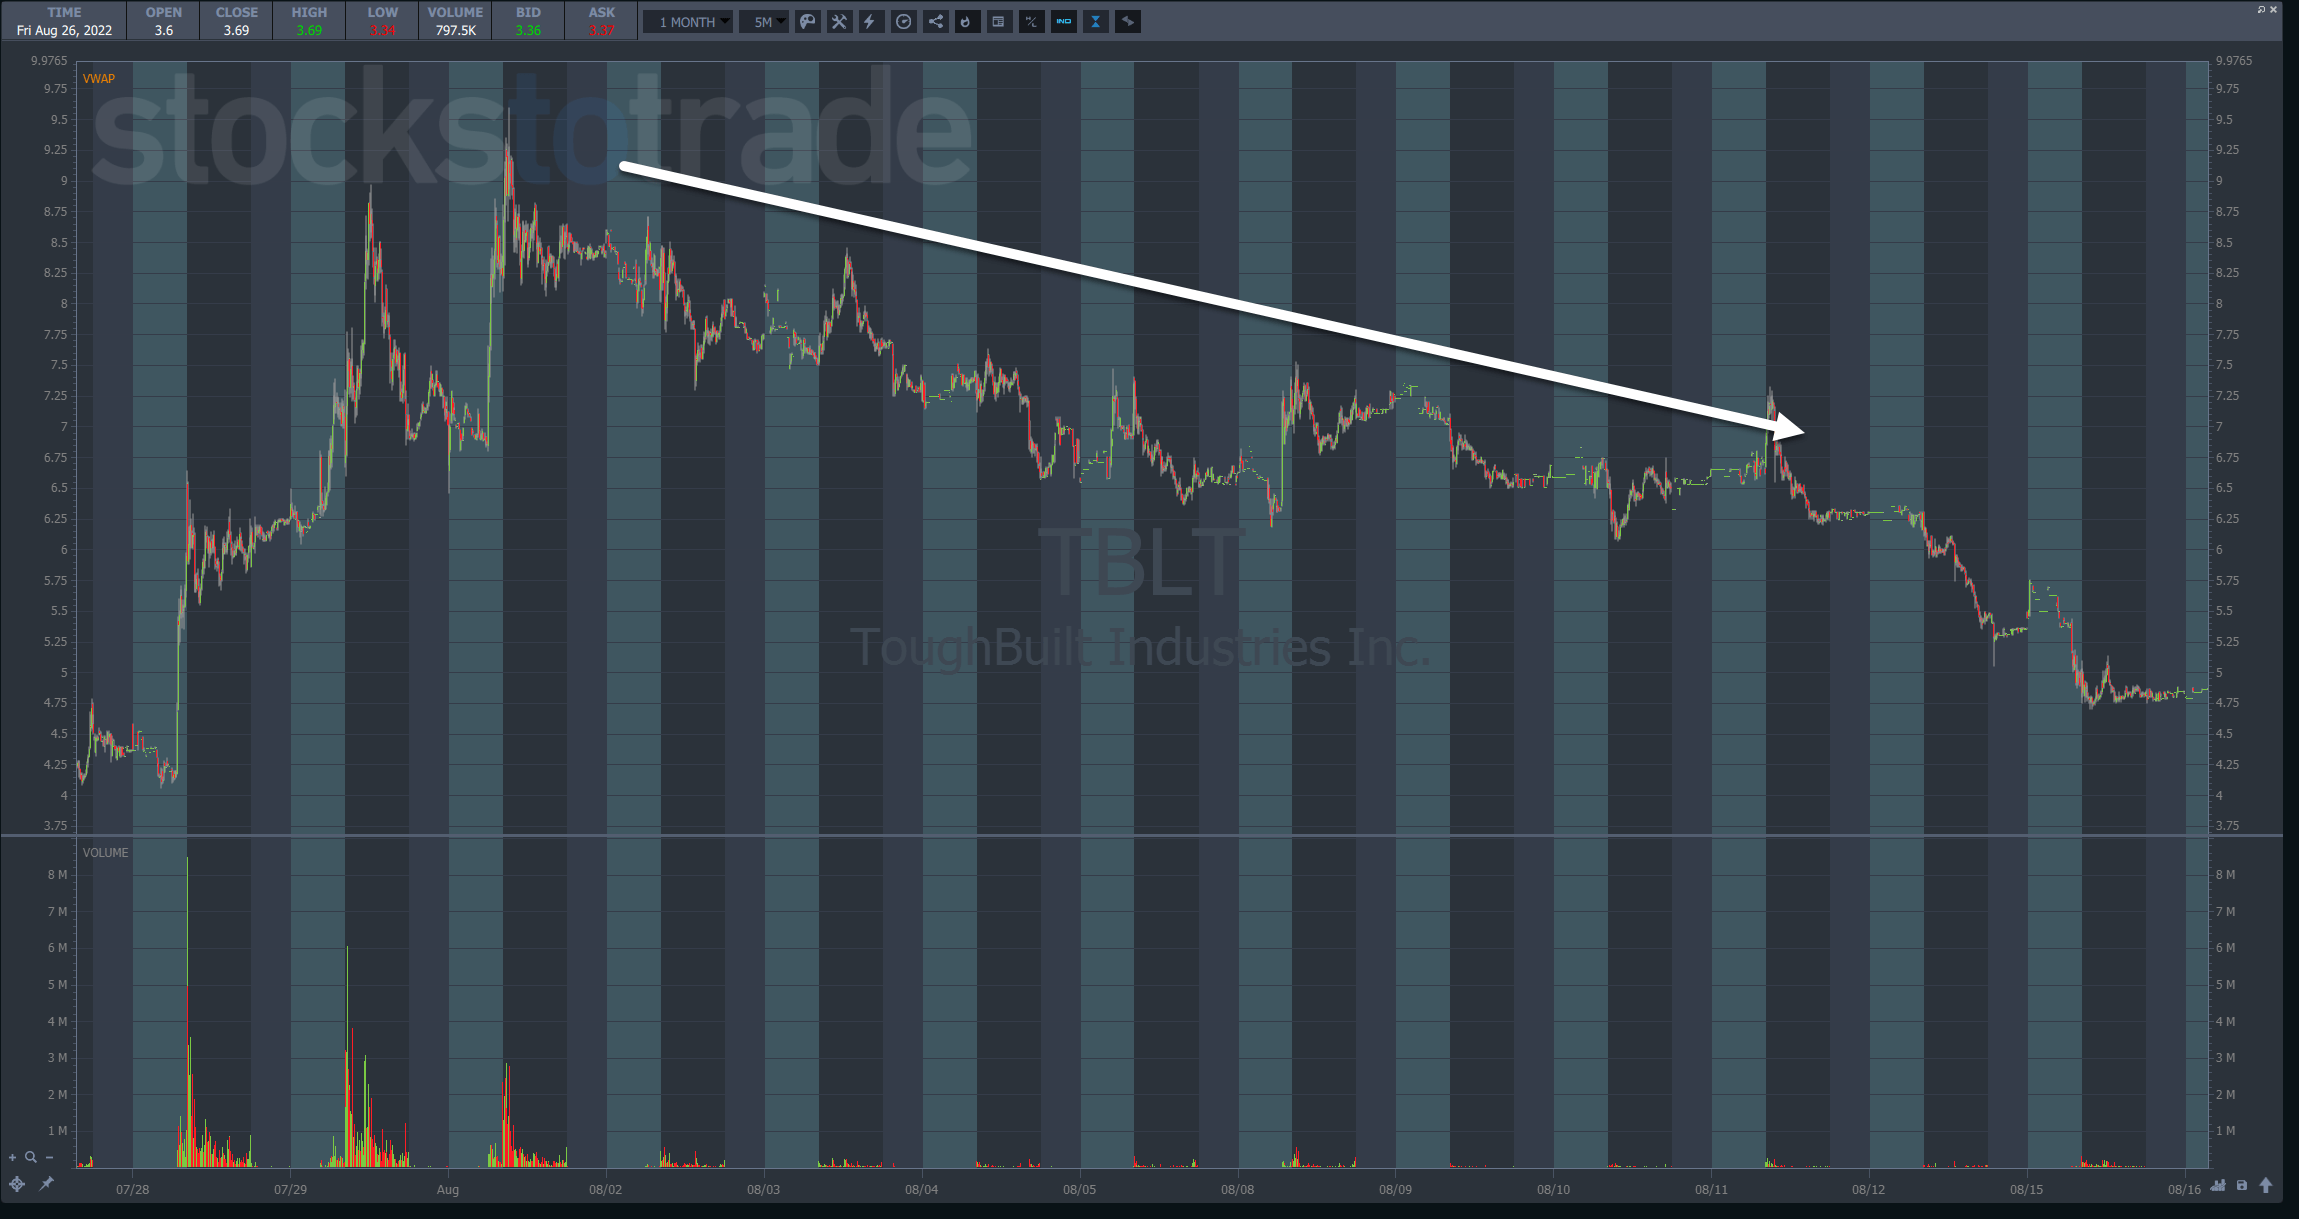
…where they bounce now and then but slowly fade into oblivion.

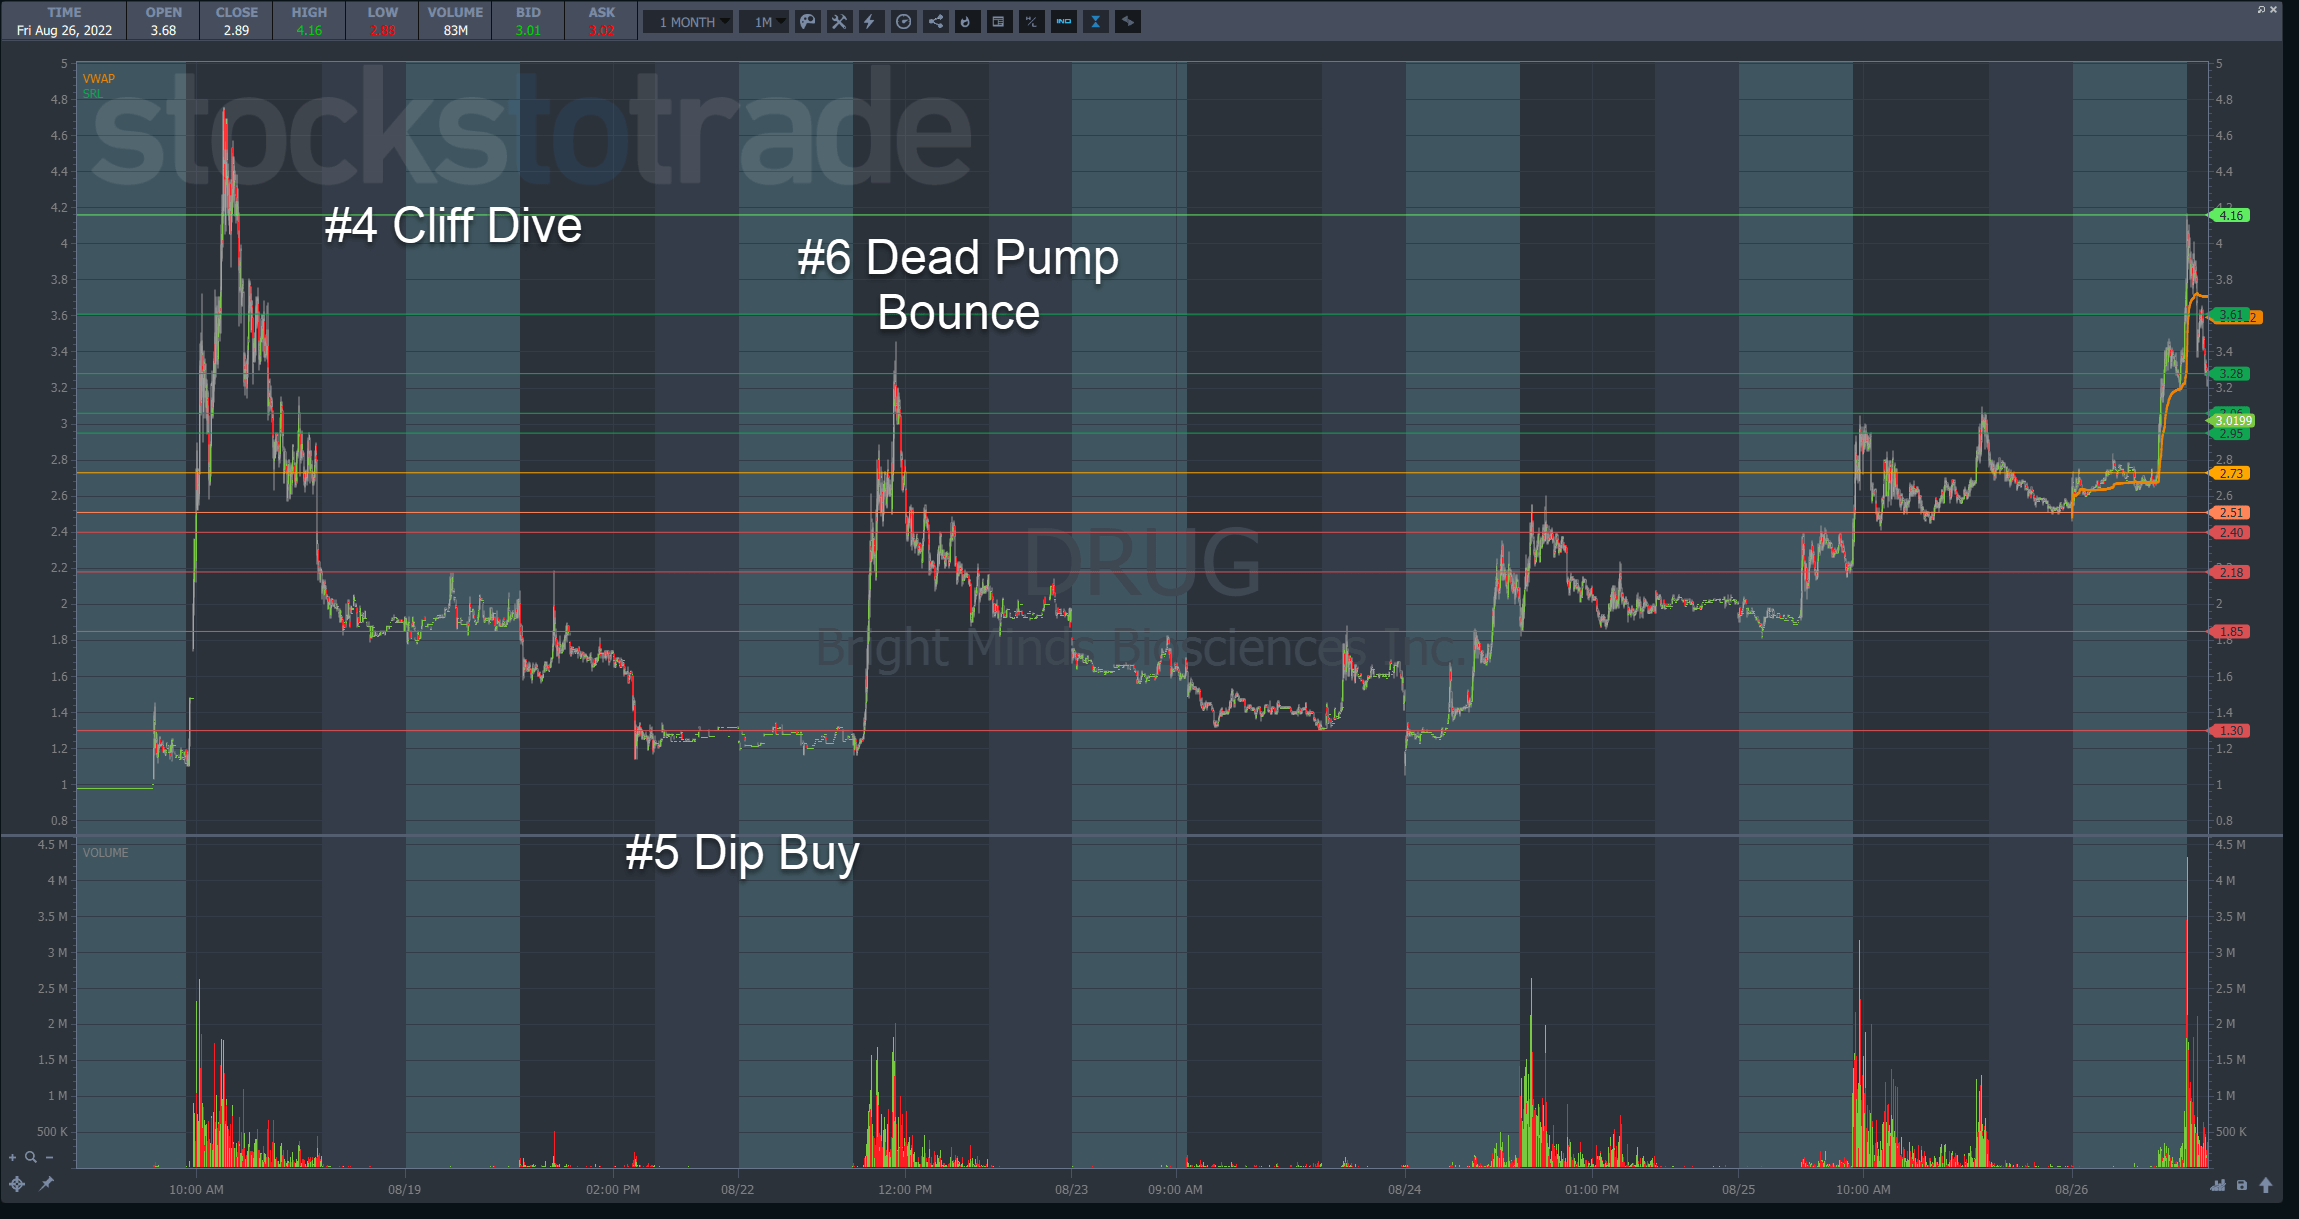
Instead of taking this typical path, DRUG held the $1.30 low from the dip buy on light volume.

But slowly, shares began to climb as volume increased.

Over the next two days, DRUG popped and consolidated to form a bullish formation.

Think about that for a moment.

A stock that’s had a tremendous run found support on light volume.

To me, that says there were few, if any, sellers at that spot.

Once buyers became more aggressive, shares began to rise.

Although there was evidence the stock wanted to make another push after the first push on the 24th, the second day’s push solidified this notion.

At that point, it makes all the sense in the world to look for a move through the highs at $3.40 from the dead pump bounce.

The key was not the lower highs but the higher lows. That narrowed the trading range, creating the elements necessary to squeeze higher.

And when the stock began to make a higher high, the writing was on the wall.

Mark took a small trade, entering somewhere around $2.70 and exiting part of the trade at around $3.00.

However, the story told by the pattern here is what’s important.

Consolidation patterns by themselves are meaningless without context.

For example, the dead pump bounce created a bullish consolidation that failed.

Why didn’t the one that came after that?

It all comes down to where they occurred in the 7-step framework and the associated price action.

That first bounce is typical after a stock goes Supernova.

The resurgence on heavy volume after that is unusual and more indicative of a spike in a previous runner that we see weeks to months down the road.

Nonetheless, the price action says what it says.

Higher lows and higher highs on heavy trading speak volumes.

Spend time learning your chart patterns. But, don’t just look for the obvious ones. Study the failures and the unusual ones like DRUG.

Look at the price action and ask yourself: what’s it trying to tell me right here?

And when you’re ready, join me in the millionaire challenge.

—Tim


How much has this post helped you?


Leave a reply


Author card Timothy Sykes picture

Timothy Sykes

Tim Sykes is a penny stock trader and teacher who became a self-made millionaire by the age of 22 by trading $12,415 of bar mitzvah money. After becoming disenchanted with the hedge fund world, he established the Tim Sykes Trading Challenge to teach aspiring traders how to follow his trading strategies. He’s been featured in a variety of media outlets including CNN, Larry King, Steve Harvey, Forbes, Men’s Journal, and more. He’s also an active philanthropist and environmental activist, a co-founder of Karmagawa, and has donated millions of dollars to charity. Read More

Post image

Get my weekly watchlist, free

Sign up to jump start your trading education!

* Results are not typical and will vary from person to person. Making money trading stocks takes time, dedication, and hard work. There are inherent risks involved with investing in the stock market, including the loss of your investment. Past performance in the market is not indicative of future results. Any investment is at your own risk. See Terms of Service here

The available research on day trading suggests that most active traders lose money. Fees and overtrading are major contributors to these losses.

A 2000 study called “Trading is Hazardous to Your Wealth: The Common Stock Investment Performance of Individual Investors” evaluated 66,465 U.S. households that held stocks from 1991 to 1996. The households that traded most averaged an 11.4% annual return during a period where the overall market gained 17.9%. These lower returns were attributed to overconfidence.

A 2014 paper (revised 2019) titled “Learning Fast or Slow?” analyzed the complete transaction history of the Taiwan Stock Exchange between 1992 and 2006. It looked at the ongoing performance of day traders in this sample, and found that 97% of day traders can expect to lose money from trading, and more than 90% of all day trading volume can be traced to investors who predictably lose money. Additionally, it tied the behavior of gamblers and drivers who get more speeding tickets to overtrading, and cited studies showing that legalized gambling has an inverse effect on trading volume.

A 2019 research study (revised 2020) called “Day Trading for a Living?” observed 19,646 Brazilian futures contract traders who started day trading from 2013 to 2015, and recorded two years of their trading activity. The study authors found that 97% of traders with more than 300 days actively trading lost money, and only 1.1% earned more than the Brazilian minimum wage ($16 USD per day). They hypothesized that the greater returns shown in previous studies did not differentiate between frequent day traders and those who traded rarely, and that more frequent trading activity decreases the chance of profitability.

These studies show the wide variance of the available data on day trading profitability. One thing that seems clear from the research is that most day traders lose money .

Millionaire Media 66 W Flagler St. Ste. 900 Miami, FL 33130 United States (888) 878-3621 This is for information purposes only as Millionaire Media LLC nor Timothy Sykes is registered as a securities broker-dealer or an investment adviser. No information herein is intended as securities brokerage, investment, tax, accounting or legal advice, as an offer or solicitation of an offer to sell or buy, or as an endorsement, recommendation or sponsorship of any company, security or fund. Millionaire Media LLC and Timothy Sykes cannot and does not assess, verify or guarantee the adequacy, accuracy or completeness of any information, the suitability or profitability of any particular investment, or the potential value of any investment or informational source. The reader bears responsibility for his/her own investment research and decisions, should seek the advice of a qualified securities professional before making any investment, and investigate and fully understand any and all risks before investing. Millionaire Media LLC and Timothy Sykes in no way warrants the solvency, financial condition, or investment advisability of any of the securities mentioned in communications or websites. In addition, Millionaire Media LLC and Timothy Sykes accepts no liability whatsoever for any direct or consequential loss arising from any use of this information. This information is not intended to be used as the sole basis of any investment decision, nor should it be construed as advice designed to meet the investment needs of any particular investor. Past performance is not necessarily indicative of future returns.

Citations for Disclaimer

Barber, Brad M. and Odean, Terrance, Trading is Hazardous to Your Wealth: The Common Stock Investment Performance of Individual Investors. Available at SSRN: “Day Trading for a Living?”

Barber, Brad M. and Lee, Yi-Tsung and Liu, Yu-Jane and Odean, Terrance and Zhang, Ke, Learning Fast or Slow? (May 28, 2019). Forthcoming: Review of Asset Pricing Studies, Available at SSRN: “https://ssrn.com/abstract=2535636”

Chague, Fernando and De-Losso, Rodrigo and Giovannetti, Bruno, Day Trading for a Living? (June 11, 2020). Available at SSRN: “https://ssrn.com/abstract=3423101”