timothy sykes logo

Patterns To Watch

Stairway Profit Pattern

Timothy SykesAvatar
Written by Timothy Sykes
Updated 9/4/2022 4 min read

Nothing makes me happier than watching my students succeed.

Mark Croock joined my trading challenge all the way back in 2010.

His hard work paid off when almost 8 years later, he hit the $1 million milestone.

So, I wasn’t too surprised when he smashed that record and earned $1.22 million in 2020!

Mark’s trading style is his own.

He trades a broader range of assets, from penny stocks to options.

So, believe me when I say he can teach you a thing or two.

That’s why one of his recent trades caught my attention.

Check out Mark’s Evolved Trader

As I stared at the chart, I realized that Mark discovered a new pattern that combined the lessons I taught with his unique perspective.

That’s why I wanted to review this trade because it works perfectly with my 7-step penny stock framework. And anyone can apply it to create a low-risk setup.

The 7-Step Framework

© Millionaire Media, LLC

Stocks create recognizable, repeatable patterns that happen over and over.

Sometimes they last for days. Sometimes they happen in a matter of hours.

Yet, they all follow the same basic framework.

You’ve probably intuitively noticed this price action before.

A stock goes parabolic and then collapses shortly thereafter.

We’ve seen it in everything from biotech trash to BItcoin.

Mark knew it would happen in Liquidia Corporation (NASDAQ: LQDA), he just didn’t know when.

Like any good trader, he kept the stock on his watchlist to see what would happen.

You’ll notice the stock didn’t collapse immediately after its run.

Shares actually traded sideways in a bullish formation.

Yet, on Tuesday, things changed.

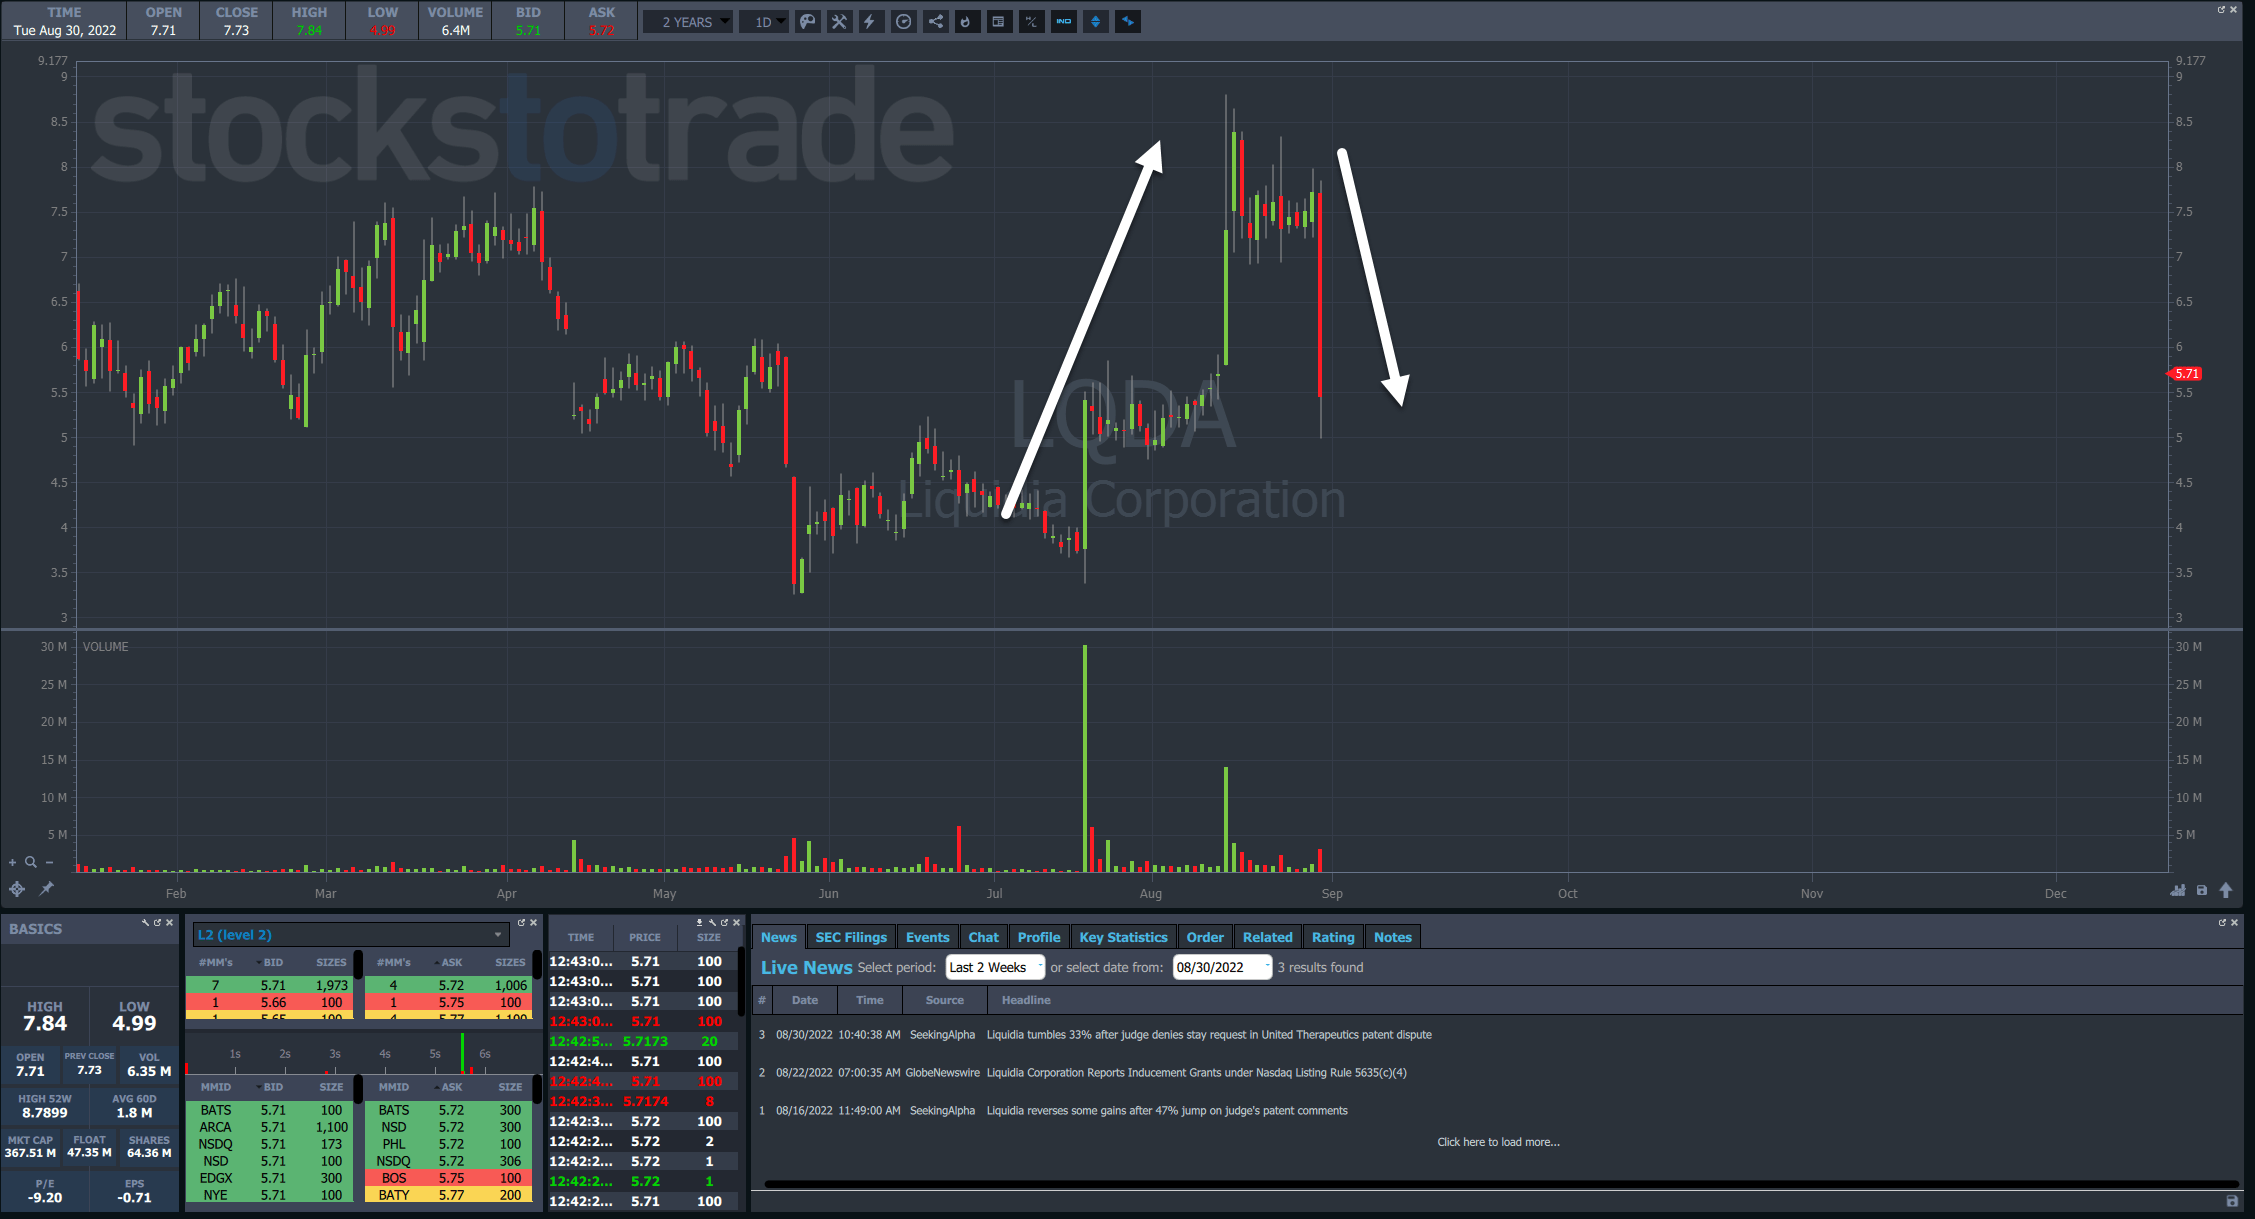
In the chart below, you’ll see how things started off quietly enough.

As the morning progressed, selling pressure increased, eventually leading to two limit down trading halts.

That kind of downward pressure creates a phenomenon known as capitulation.

Essentially, all the sellers are exhausted and a bottom is formed.

Knowing this, Mark was looking for a panic dip buy on the stock.

However, he didn’t want to jump in without some confidence the stock had found a low.

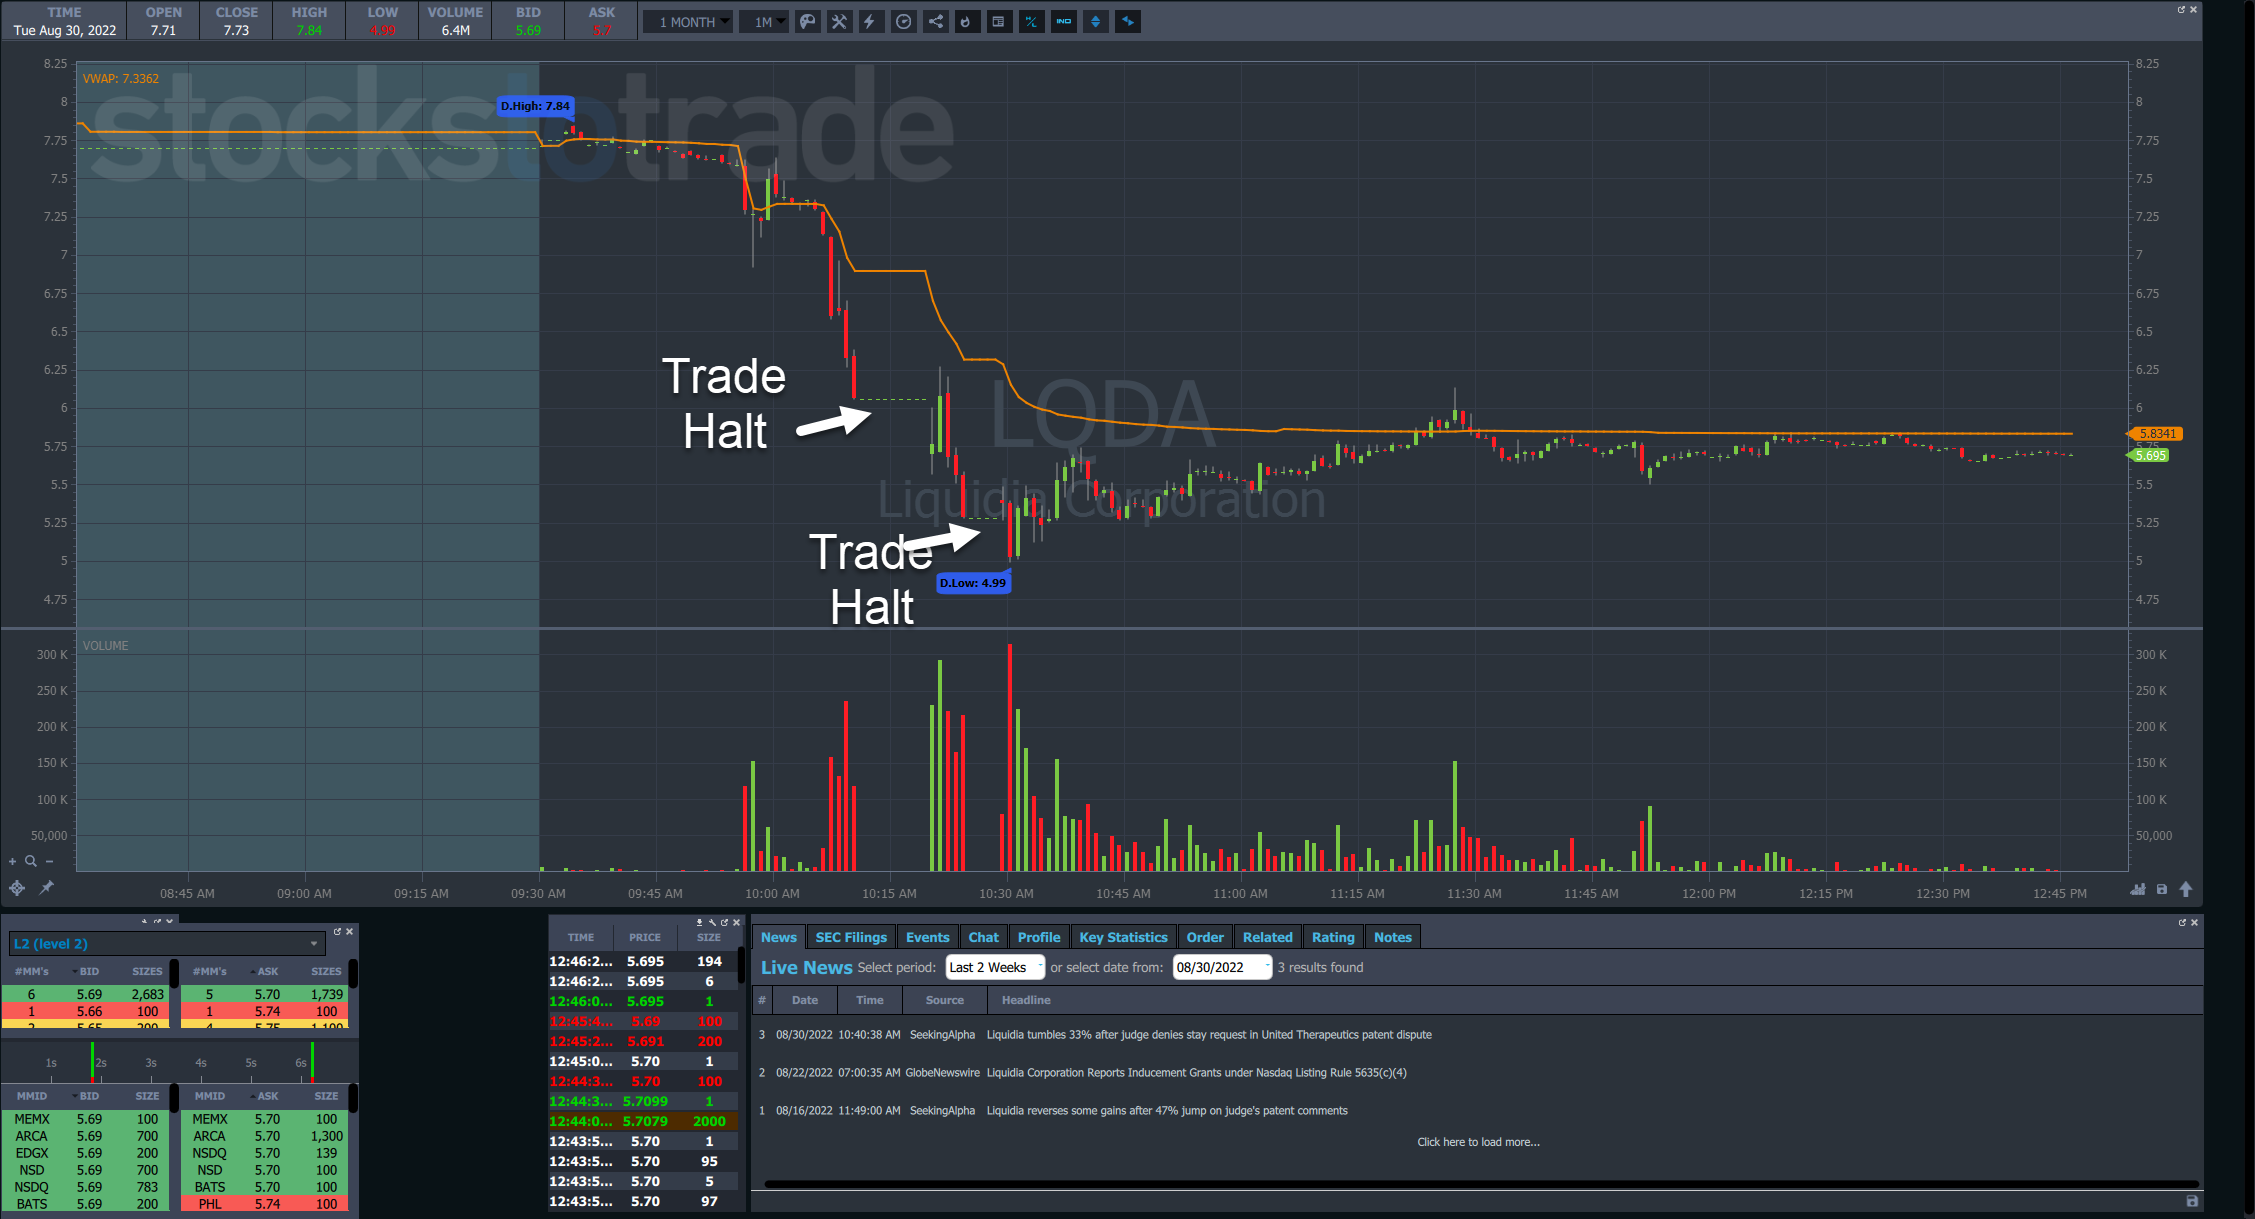
So, he waited for roughly 30 minutes and watched as the stock began to create a stair step of one bullish pattern after another.

You probably recognize this as a bullish consolidation.

It appears on charts of all varieties and timeframes.

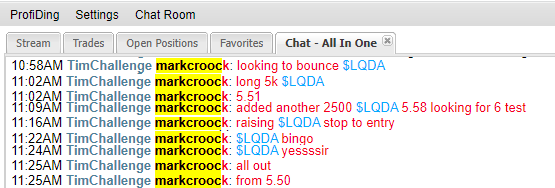
Using the first pullback pattern, Mark took his initial position around $5.50.

The cool part about these patterns is you can use the bottom of the large green candlesticks as your stop, usually on a candle close below the low.

That keeps your risk small while maximizing the upside potential.

In fact, Mark used the second pattern formed to add to his position.

Finally, he rode the bullish float until shares put in a reversal candle near his $6.00 target.

When I step into panic dip buys, I typically look for high-volume reversal candles or a wall of buyers on level 2 data.

Mark’s method took what I did and added his own flavor.

If we go back in time a few weeks, you’ll see the same pattern in the chart for Intelligent Living Application Group Inc. (NASDAQ: ILAG).

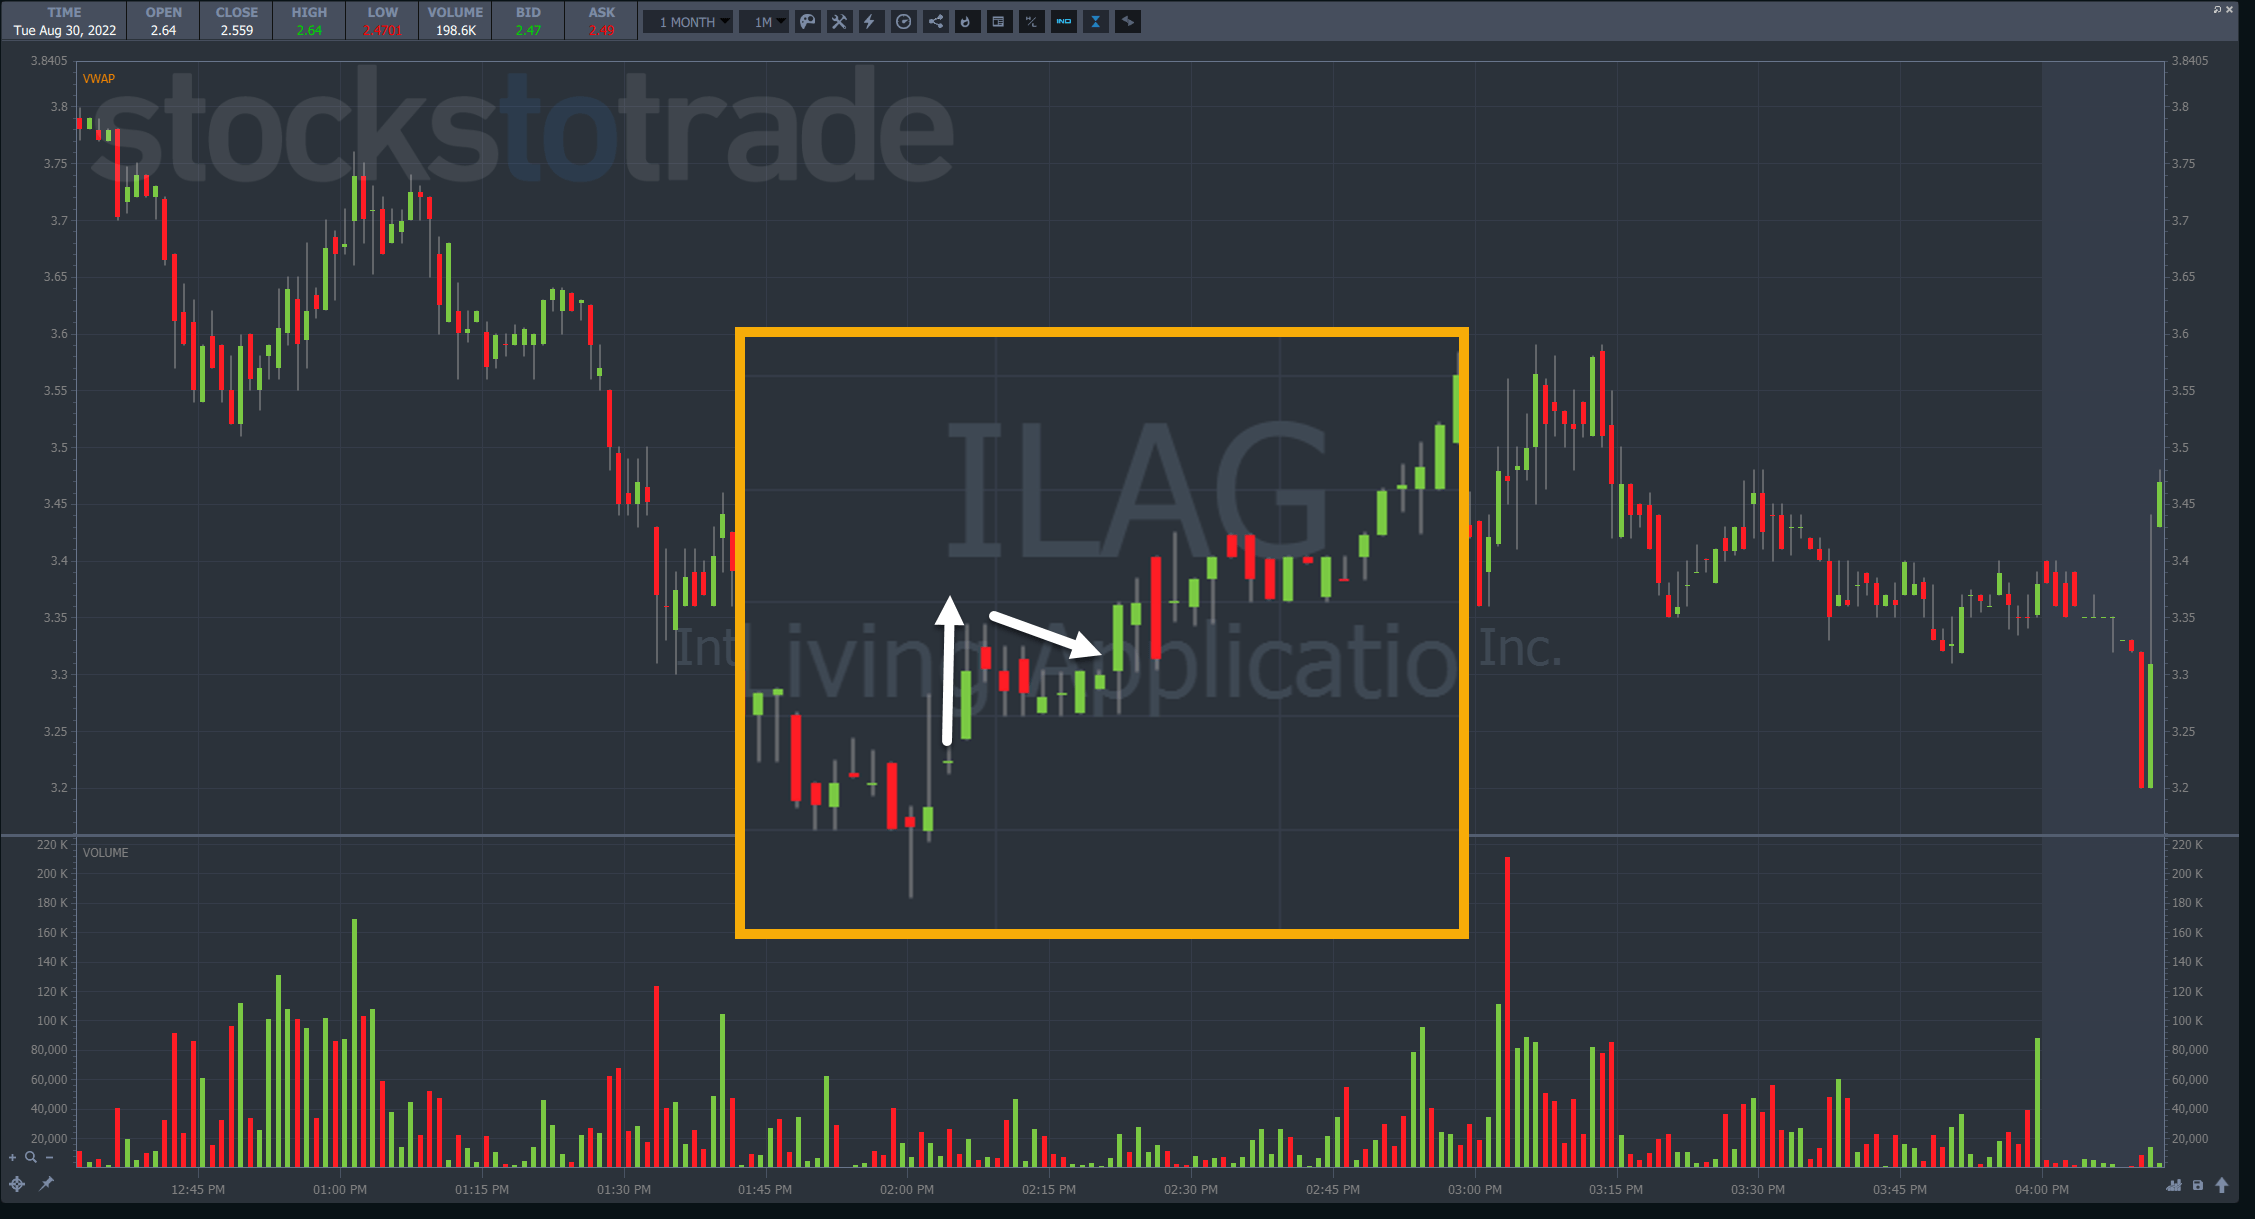
Shares soared out of the gate on August 15th. They made a high just shy of $4.40 before collapsing back down to $3.25.

That low didn’t have a lot of volume associated with it.

Yet, you could’ve used Mark’s pattern here to take a low-risk entry around $3.30 and play for a nice bounce into the close.

Final Thoughts

© Millionaire Media, LLC

Most of my students have different ways of trading the market.

We learn from each other and grow as traders.

That’s why I encourage you to join my millionaire challenge and begin your unique journey.

–Tim


How much has this post helped you?


Leave a reply


Author card Timothy Sykes picture

Timothy Sykes

Tim Sykes is a penny stock trader and teacher who became a self-made millionaire by the age of 22 by trading $12,415 of bar mitzvah money. After becoming disenchanted with the hedge fund world, he established the Tim Sykes Trading Challenge to teach aspiring traders how to follow his trading strategies. He’s been featured in a variety of media outlets including CNN, Larry King, Steve Harvey, Forbes, Men’s Journal, and more. He’s also an active philanthropist and environmental activist, a co-founder of Karmagawa, and has donated millions of dollars to charity. Read More

Post image

Get my weekly watchlist, free

Sign up to jump start your trading education!

* Results are not typical and will vary from person to person. Making money trading stocks takes time, dedication, and hard work. There are inherent risks involved with investing in the stock market, including the loss of your investment. Past performance in the market is not indicative of future results. Any investment is at your own risk. See Terms of Service here

The available research on day trading suggests that most active traders lose money. Fees and overtrading are major contributors to these losses.

A 2000 study called “Trading is Hazardous to Your Wealth: The Common Stock Investment Performance of Individual Investors” evaluated 66,465 U.S. households that held stocks from 1991 to 1996. The households that traded most averaged an 11.4% annual return during a period where the overall market gained 17.9%. These lower returns were attributed to overconfidence.

A 2014 paper (revised 2019) titled “Learning Fast or Slow?” analyzed the complete transaction history of the Taiwan Stock Exchange between 1992 and 2006. It looked at the ongoing performance of day traders in this sample, and found that 97% of day traders can expect to lose money from trading, and more than 90% of all day trading volume can be traced to investors who predictably lose money. Additionally, it tied the behavior of gamblers and drivers who get more speeding tickets to overtrading, and cited studies showing that legalized gambling has an inverse effect on trading volume.

A 2019 research study (revised 2020) called “Day Trading for a Living?” observed 19,646 Brazilian futures contract traders who started day trading from 2013 to 2015, and recorded two years of their trading activity. The study authors found that 97% of traders with more than 300 days actively trading lost money, and only 1.1% earned more than the Brazilian minimum wage ($16 USD per day). They hypothesized that the greater returns shown in previous studies did not differentiate between frequent day traders and those who traded rarely, and that more frequent trading activity decreases the chance of profitability.

These studies show the wide variance of the available data on day trading profitability. One thing that seems clear from the research is that most day traders lose money .

Millionaire Media 66 W Flagler St. Ste. 900 Miami, FL 33130 United States (888) 878-3621 This is for information purposes only as Millionaire Media LLC nor Timothy Sykes is registered as a securities broker-dealer or an investment adviser. No information herein is intended as securities brokerage, investment, tax, accounting or legal advice, as an offer or solicitation of an offer to sell or buy, or as an endorsement, recommendation or sponsorship of any company, security or fund. Millionaire Media LLC and Timothy Sykes cannot and does not assess, verify or guarantee the adequacy, accuracy or completeness of any information, the suitability or profitability of any particular investment, or the potential value of any investment or informational source. The reader bears responsibility for his/her own investment research and decisions, should seek the advice of a qualified securities professional before making any investment, and investigate and fully understand any and all risks before investing. Millionaire Media LLC and Timothy Sykes in no way warrants the solvency, financial condition, or investment advisability of any of the securities mentioned in communications or websites. In addition, Millionaire Media LLC and Timothy Sykes accepts no liability whatsoever for any direct or consequential loss arising from any use of this information. This information is not intended to be used as the sole basis of any investment decision, nor should it be construed as advice designed to meet the investment needs of any particular investor. Past performance is not necessarily indicative of future returns.

Citations for Disclaimer

Barber, Brad M. and Odean, Terrance, Trading is Hazardous to Your Wealth: The Common Stock Investment Performance of Individual Investors. Available at SSRN: “Day Trading for a Living?”

Barber, Brad M. and Lee, Yi-Tsung and Liu, Yu-Jane and Odean, Terrance and Zhang, Ke, Learning Fast or Slow? (May 28, 2019). Forthcoming: Review of Asset Pricing Studies, Available at SSRN: “https://ssrn.com/abstract=2535636”

Chague, Fernando and De-Losso, Rodrigo and Giovannetti, Bruno, Day Trading for a Living? (June 11, 2020). Available at SSRN: “https://ssrn.com/abstract=3423101”