Markets are teetering on the edge of a cliff.
Just one push could send them into a free fall and take EVERY stock with them…
Well, almost every stock.
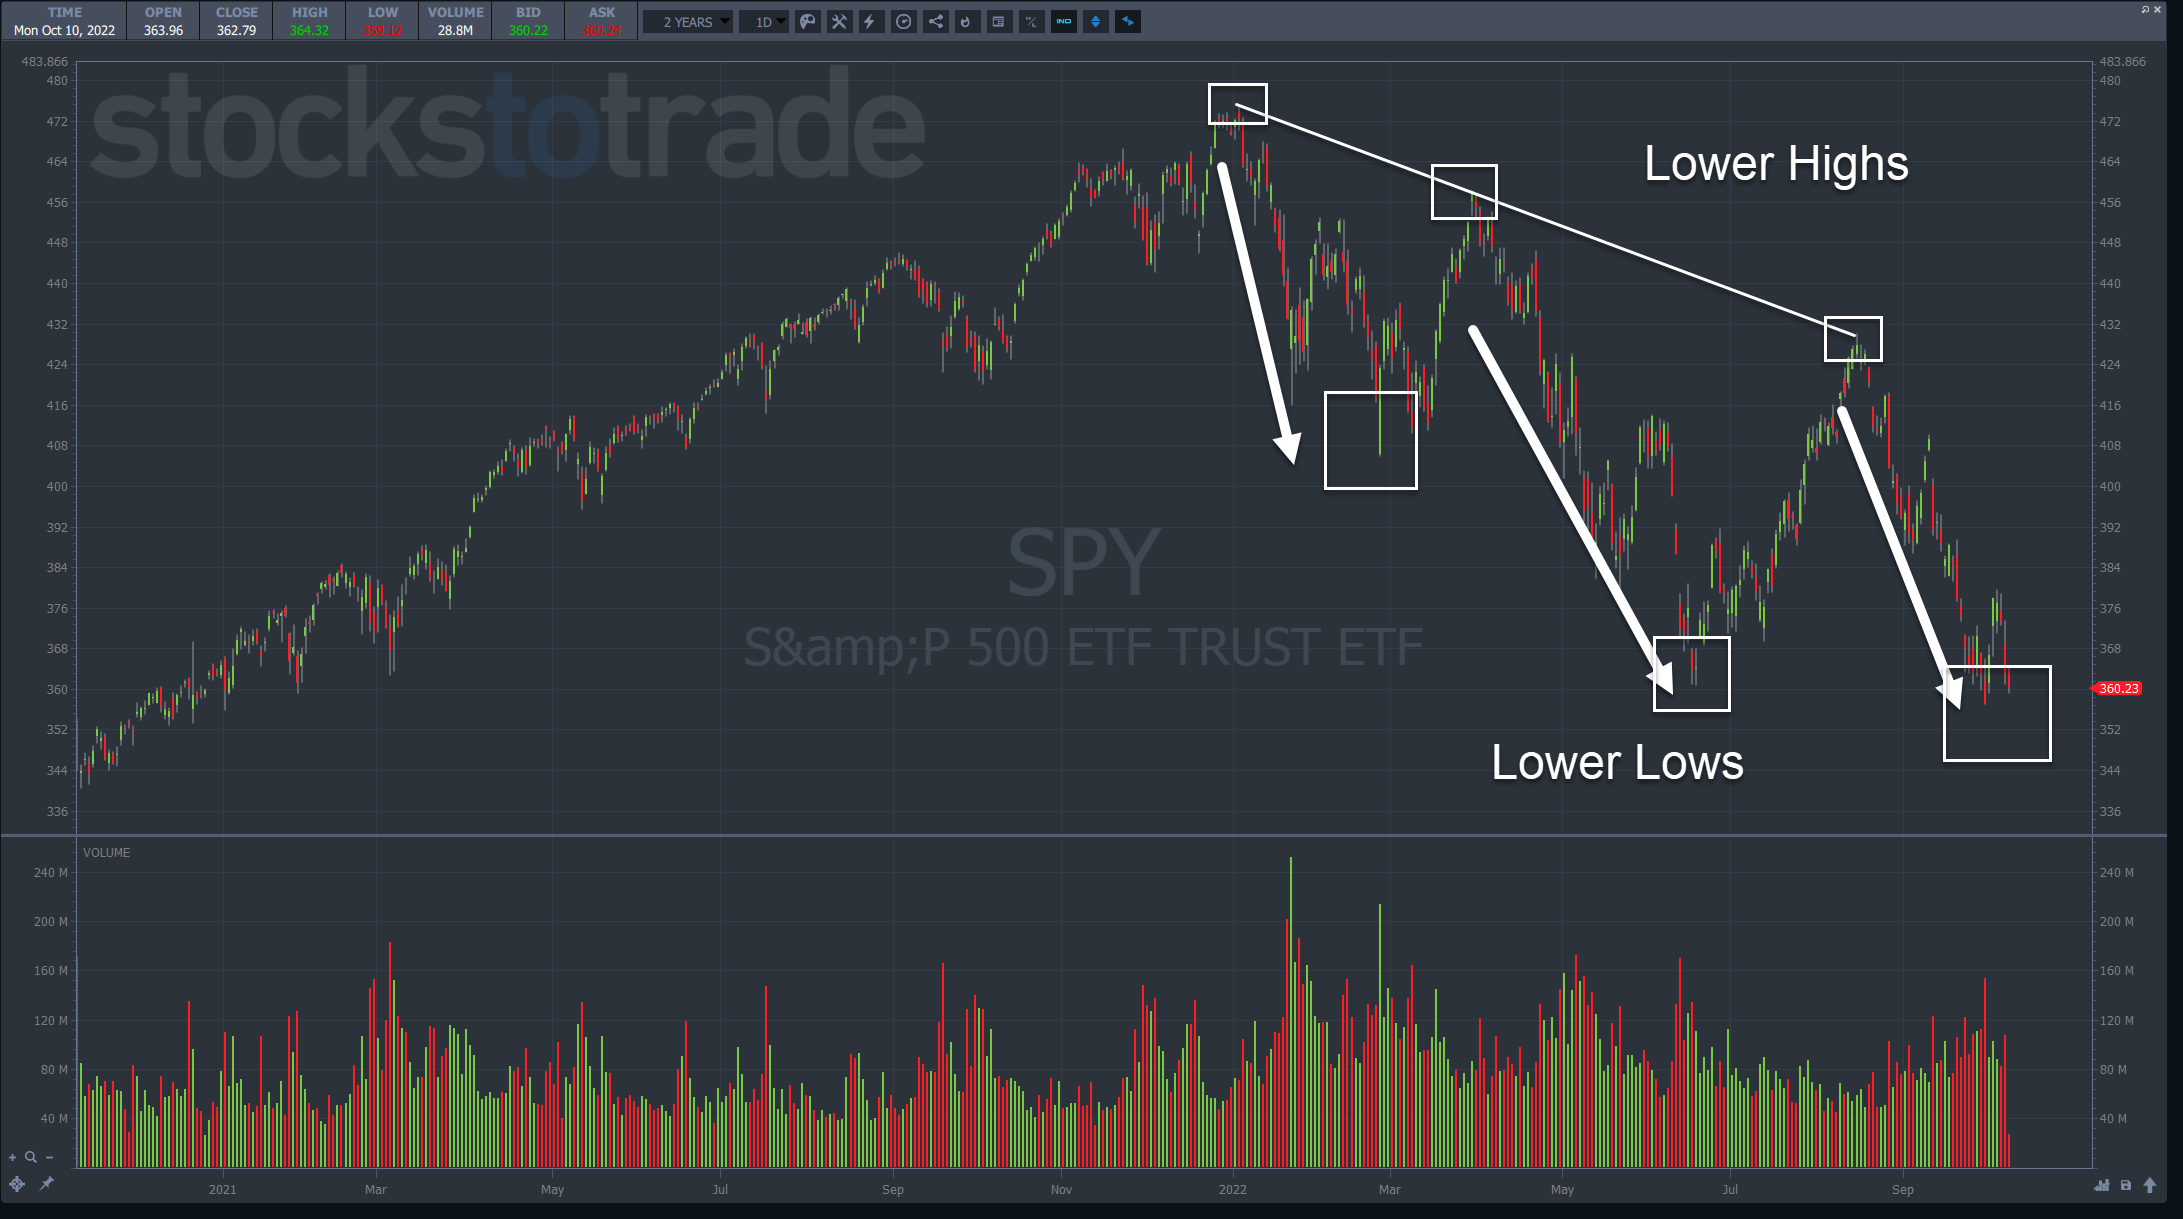
Right now, waves of sellers greet every S&P 500 rally with a smack.
Basic chart technical analysis says even lower prices are in the cards.
Thankfully, I know how to make money in ANY market.
You see, some patterns like the SUPERNOVA are so strong they can overpower heavy selling pressure.
One of my favorites right now is Global Tech Industries Group Inc. (OTC: GTII).
While CNBC sheep are freaking out about their 401Ks, I’ve taken 9 trades on GTII since Sept. 22, netting $3,511.84 on 6 winners and 3 losses…
Both on the long AND short side.
The good news is when markets finally bottom, we’ll see some of the BEST OPPORTUNITIES in years.
That’s why I’m about to share with you the EXACT blueprint I laid out for my STUDENTS this weekend.
In it, you’ll discover what I look for in a market bottom and how I maximize my chances of riding the huge reversal.
But there is one KEY thing to remember….
Markets Fall Further Than You Think

Penny stocks give most traders ulcers.
They rise and fall by tens, if not hundreds, of percentage points in a single day.
Watch it long enough, and you get desensitized to the movement, which is a good thing.
In my 20+ years of trading, I’ve seen individual stocks and markets rise and fall much more than anyone expected.
The dumbest thing anyone can claim is a stock can’t fall any further because it’s already down XX%.
Take NVIDIA Corporation (NASDAQ: NVDA), for example.
This profitable tech company is down more than 65% from its peak.
Yet, it’s up more than 275% from its 2019 lows.
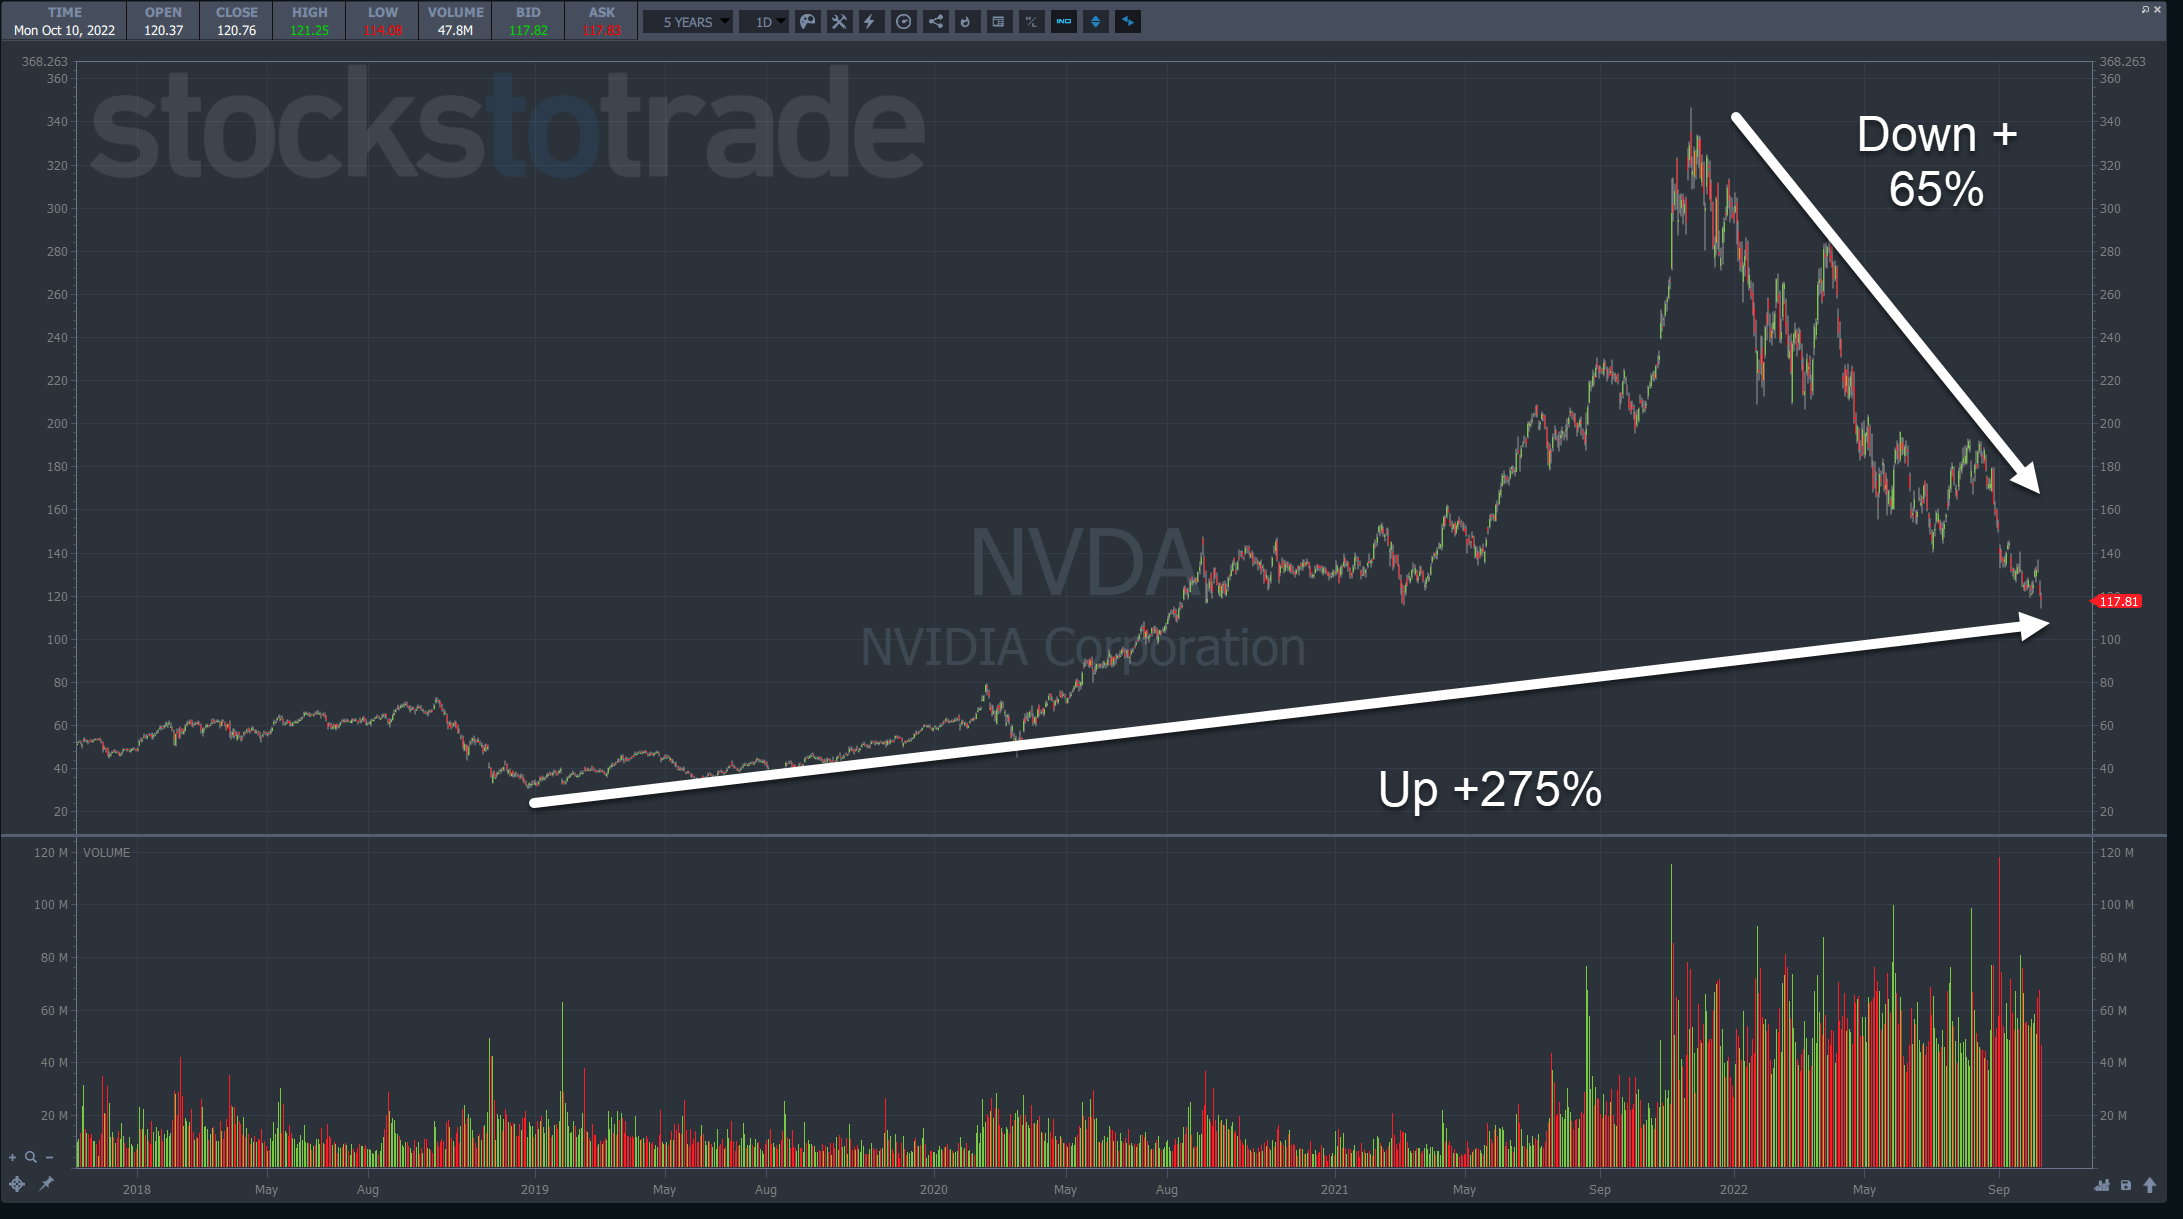
The S&P 500 isn’t even down 25% from its highs.
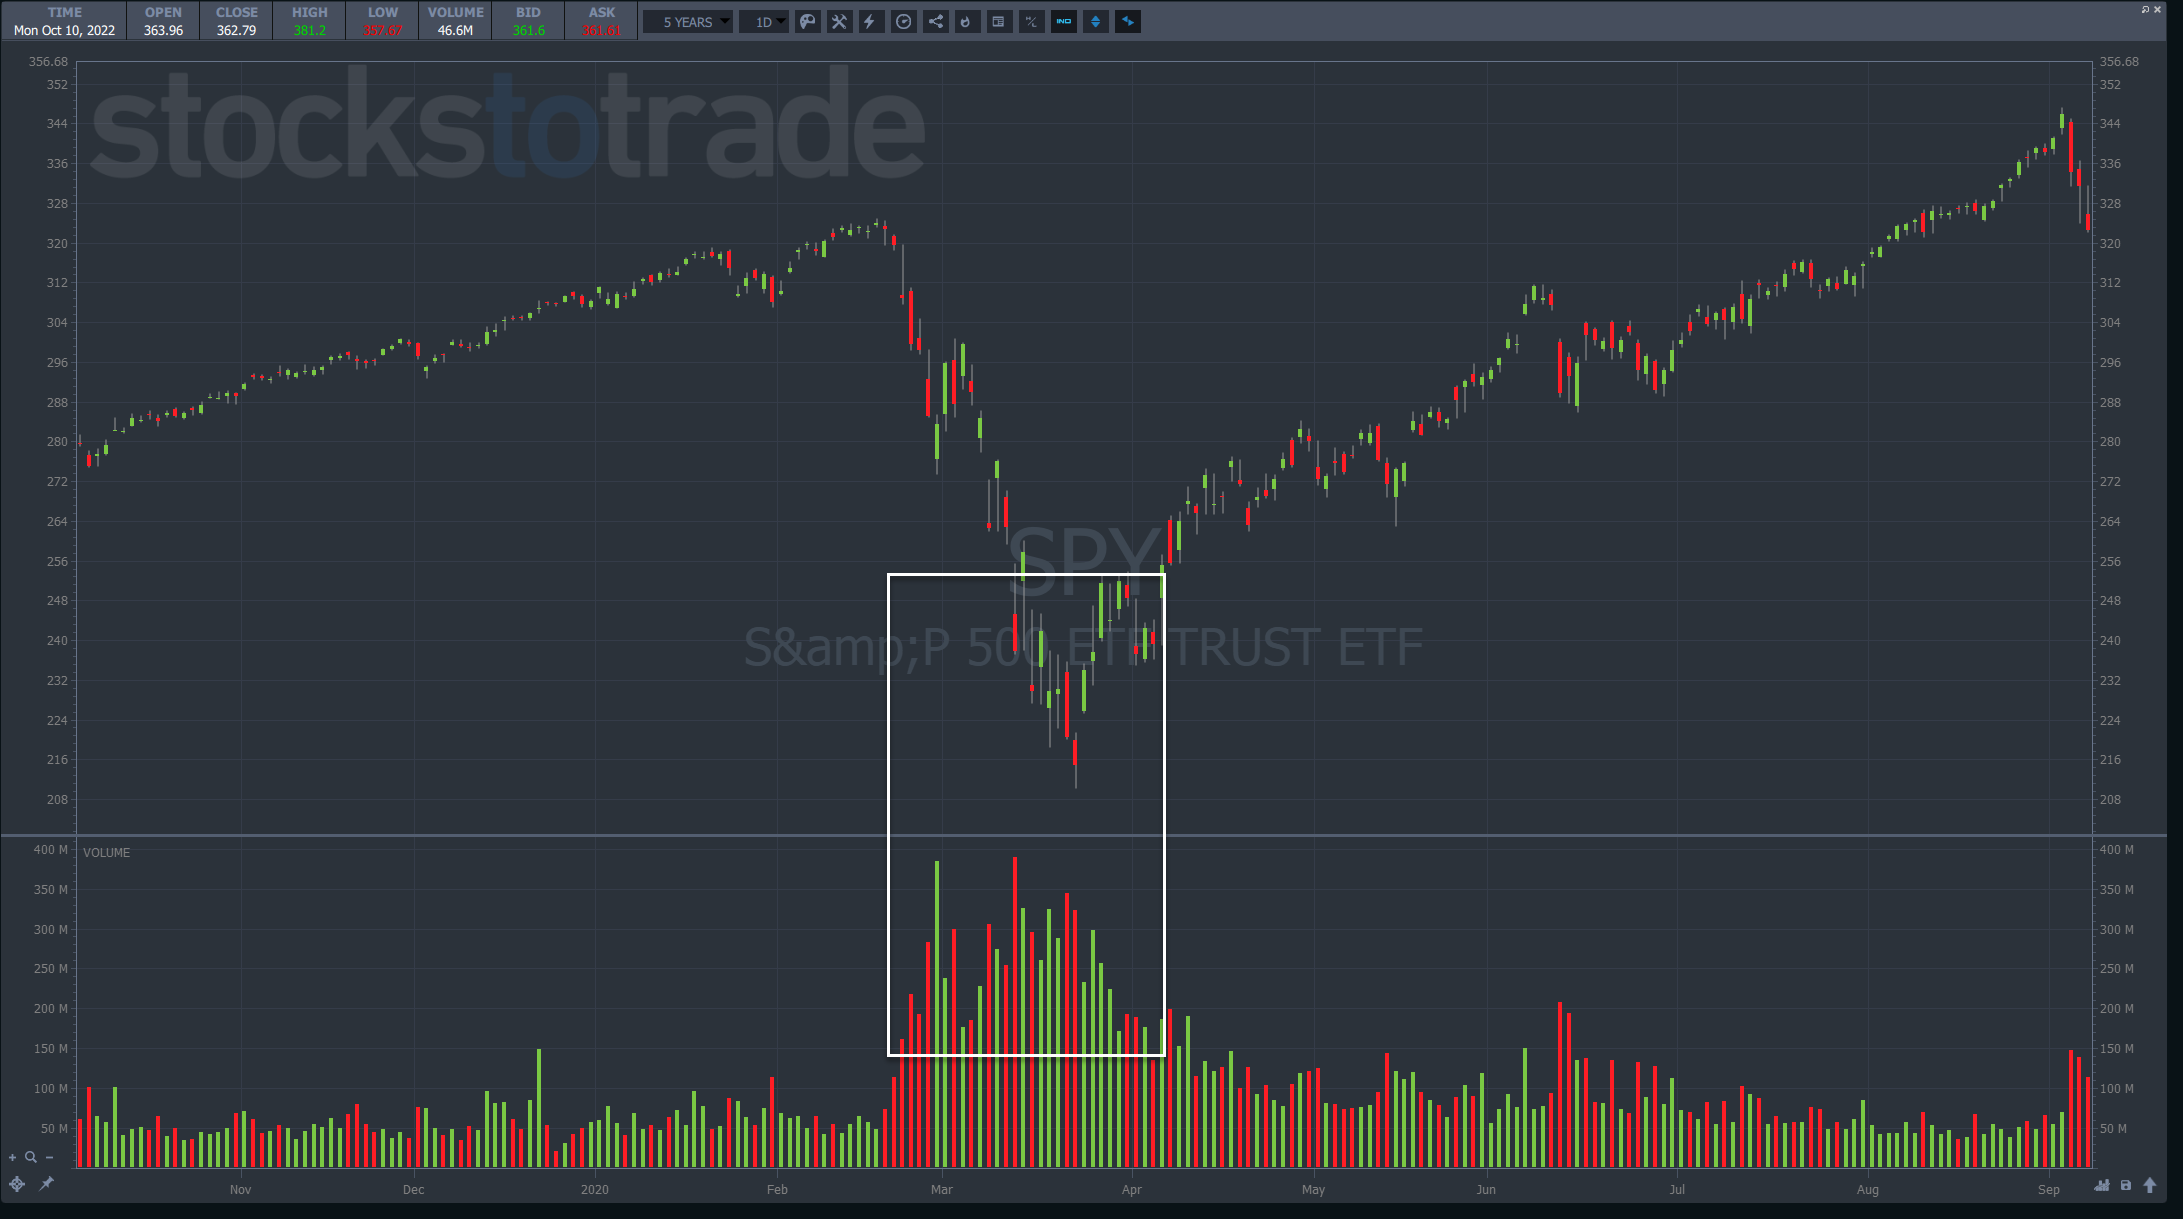
When stocks fell during the pandemic swoon, they fell more than 35% before bottoming.
My point is that picking out the exact bottom before it happens is tough.
Identifying Market Bottoms

Instead, I look for signs of a bottom and use the price action to confirm my thesis.
Markets tend to bottom on high volume and wide trading ranges.
Sometimes it’s a one and done event like we saw in 2020.
Other times, markets need several attempts to form a bottom as they did back in 2008-2009.
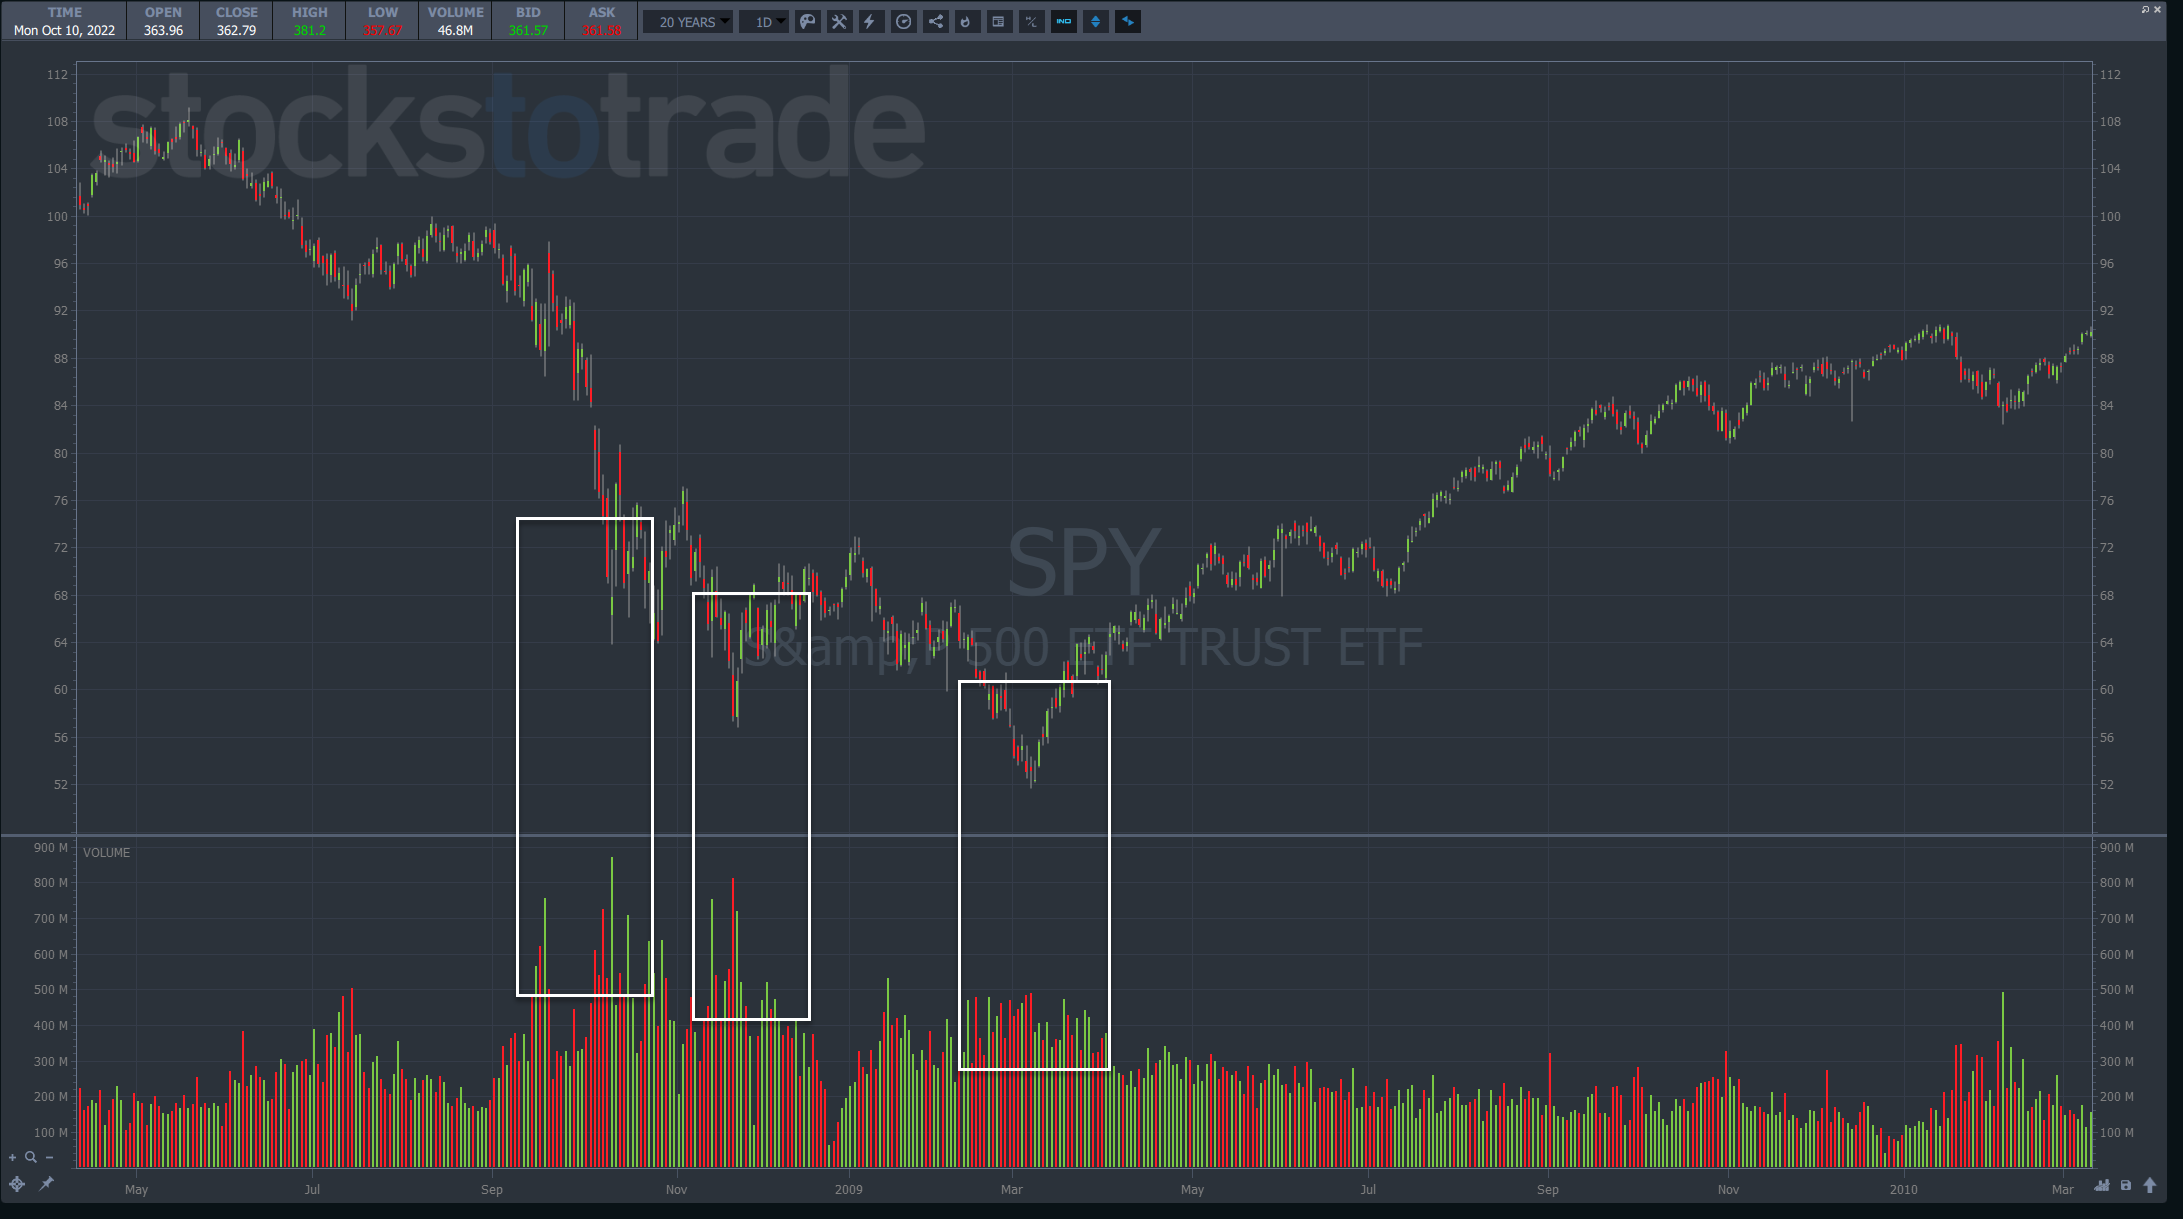
Interestingly, back then, the final bottom happened on lower volume than the prior two attempts.
When markets drop, everything tends to fall, with few exceptions.
However, right near a bottom, pockets of strength tend to pop up.
In 2020, we saw Amazon bottom out before the broader market.
Back in 2008-2009, the Nasdaq 100 bottomed in November 2008, nearly four months before the rest of the market.
That’s why I developed a method of trading that tests the waters of hot sectors, looking for potential leaders.
Trust But Verify

With my account up nicely on the year, I see no reason to put it in danger.
However, I don’t want my students to miss the HUGE opportunities on the horizon.
So, I experiment with small trades in different sectors every week.
By using a wide cross section of stocks, I tune myself to the active market and get a feel for what’s working and what isn’t.
Plus, it allows me to practice my trading skills and learn even more about this trading environment.
At the moment, I’m only focused on a handful of SUPERNOVA stocks with heavy promoters like GTII or FingerMotion Inc. (NASDAQ: FNGR).
But I’m also on the lookout for themed movements like we saw with cannabis stocks the other day.
A basket of similar stocks moving higher can signal a potential shift, even temporarily.
I put these names on my watchlist to avoid getting blown out, look for setups, and take small positions.
If I lose, I keep it small and fast.
Otherwise, when those big runners happen, I’m at the party for the fun.
Making money during the good times is easy.
Surviving during the tough times is what matters.
—Tim

Leave a reply