Breakout trades are one of the most popular setups out there.
They’re also one of the hardest to master.
Jump in too early, and you risk a fakeout.
Wait for confirmation, and you might miss the move entirely.
Yesterday’s blog post offered some tips on breakout trades.
Today, I want to take you inside a trade I posted in the chat room.

All my trades are posted on Profitly for the viewing public.
GlycoMimetics Inc. (NASDAQ: GLYC) has been on my watchlist since it first started its run in early November.
Unlike most penny stocks which fade after the initial run, GLYC held its gains.
I know a lot of breakout traders who bought into the fake break a few weeks ago.
But I wasn’t fooled.
There was something specific I wanted to see.
And here’s what it was.
Don’t Take the Fake

Picture a brick wall in front of you.
Now, imagine you have a sledgehammer to break through the wall.
Your goal is to make a hole that allows you to step through.
After a few swings your arms get tired so you take a break.
You start again and suddenly make a small hole.
Excited, you swing like a maniac but don’t make much more progress.
So, you take another break before going back at it.
Eventually, you chip away but keep yourself calm.
Slowly and methodically, you break down the wall until you finally have a hole to fit through.
But man, are you tired!
This is what it’s like for a stock to break through resistance.
It takes time before it can make the next move.
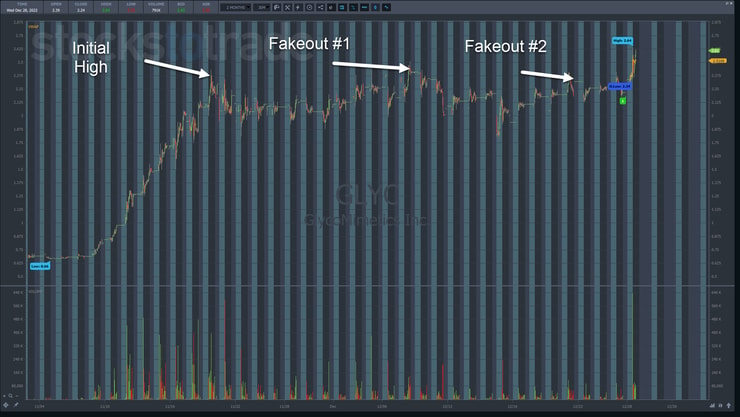
That’s why there’s often a fake break through resistance once or even twice before the real move.
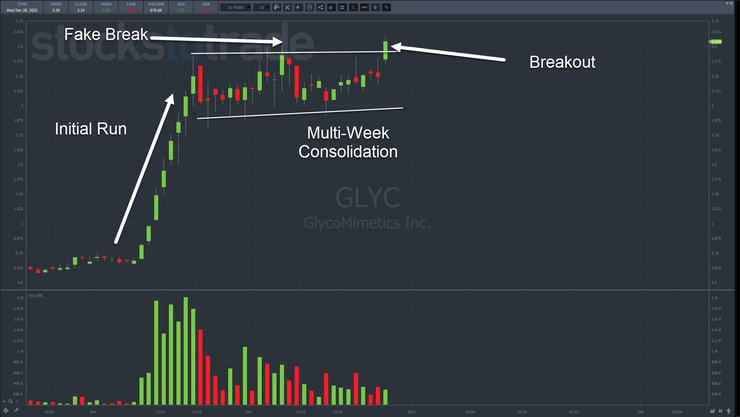
In the GLYC 30-minute chart above, you’ll see how shares consolidated sideways for weeks before making an attempt to break out.
If a stock doesn’t keep running off the initial move or within a couple of days, it often needs to consolidate before continuing higher.
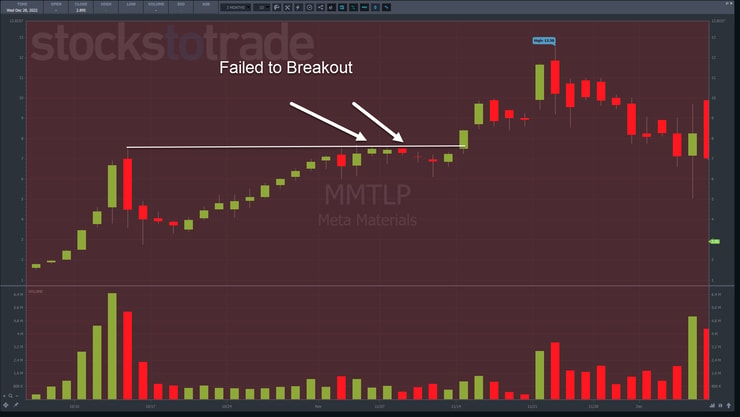
You can find a similar pattern in Meta Materials (OTC: MMTLP) from November 14.
After making a high in October, shares pulled back before creeping higher.
Yet, they stopped at the high and took a week of testing and trading near the level before breaking out.
And that’s the key here.
I want to see several tests of the high before banking on a breakout.
An Inside Look

Let’s dig into the execution to see how I managed the trade.
The high put in on the initial run was $2.43, while the fake break got up to $2.50.
The high from the previous day was $2.41, which was also the high from the 21st.
Also, the close from the previous day was $2.24.
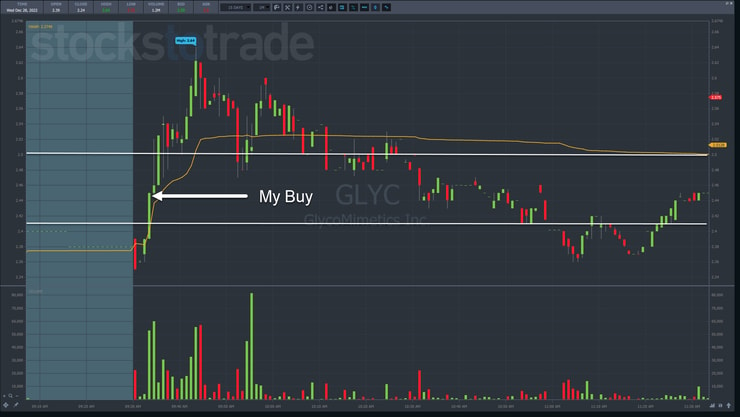
This one-minute chart has white lines at $2.41 and $2.50.
Shares opened at $2.39, up 2.2%.
That’s not huge, but it put it close to the highs from the previous day.
Price quickly broke through that on heavy volume after the first three minutes of light volume.
Since GLYC already tested the highs multiple times over the past few weeks, it stands to reason it would break through on enough volume.
So, I jumped in at $2.45 with a stop on the day’s lows of $2.35.
My goal was a 10% move which would get me to $2.70.
Shares never got that high, topping out at $2.64.
I cut my position at $2.58.
It wasn’t a huge win…but that’s ok.
More Breaking News
- Coeur Mining’s Acquisition of New Gold Approved by British Columbia Court
- Bitfarms Plans for U.S. Redomiciliation and Debt Repayment Spark Investor Interest
- BigBear.ai Expands Partnerships and Strengthens Financial Position
- Redfin’s ChatGPT Integration Enhances Home Search, Boosts Rocket Companies’ Market Presence
The pattern and setup were there, supported by price action.
Key Points to Remember

I chose this setup for several reasons:
- Shares tested the highs multiple times
- The stock opened higher
- Price broke through key resistance on decent volume
- Like most stocks on my watchlist, this was one heavily promoted
Sometimes breakout plays come up short of my goals. Other times, they become monsters like MMTLP.
You never know what you’ll get, which is why it’s important to understand the setup, manage your risk, and cut losses quickly.
Not every trade will work.
But when you select setups and stocks that meet the right criteria, it greatly improves the odds of success.
–Tim


Leave a reply