timothy sykes logo

Patterns To Watch

Can Penny Stock Patterns Apply to Options Trading?

Timothy SykesAvatar
Written by Timothy Sykes
Updated 11/29/2022 6 min read

Imagine being stuck in a 9-5 job that makes you miserable.

There is some job security, but you feel like a rat in a maze.

You’re afraid to wake up in 40 years, look back at your life, and wonder what could have been.

If only there were some way to change the situation.

Mark Croock found himself in this exact spot more than a decade ago.

A darn good accountant, Mark had a steady paycheck and decent benefits…

Yet, he wanted more from life.

In 2009, he found me on YouTube and quickly realized trading was his way out.

By 2010, he quit his job, joined my Millionaire Challenge, and began trading full-time.

Mark started as a penny stock trader and morphed into an options trader, something few folks do.

It wasn’t an easy path, but it was his OWN path.

Today, he’s closing in on $4 million in lifetime profits and runs his own successful service – The Evolved Trader, making him one of my greatest success stories.

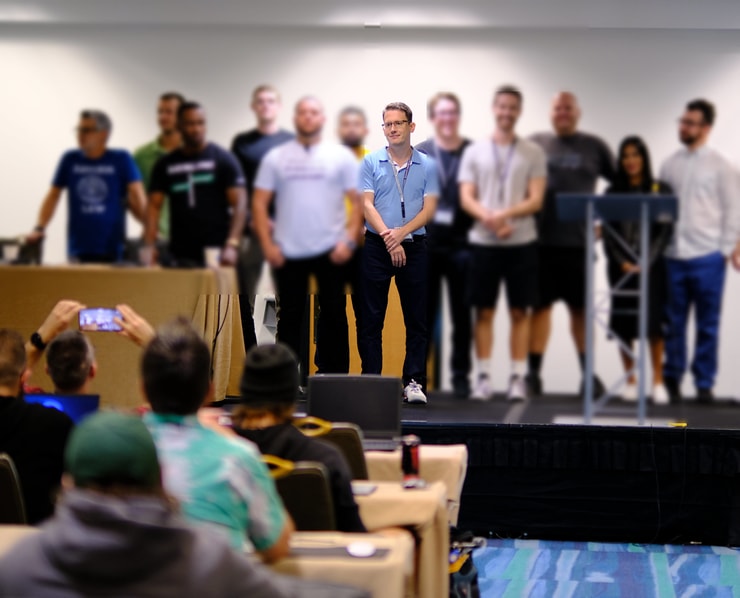
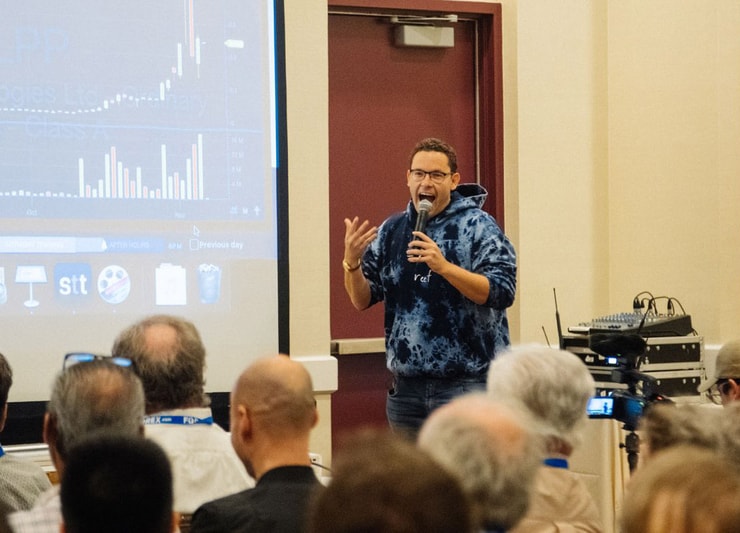
Speaking to attendees at our trading conference, Mark explained the moment he discovered the universality of my Supernova pattern.

It immediately became clear that he could locate the same types of trades that I teach through my 7-Step Penny Stock Framework.

To maximize his potential, Mark turned to options trading.

He keeps it simple, buying calls and puts.

Now, penny stock trading may not be for everyone.

But I want to show you how Mark applies the same penny stock framework I teach to large-cap names.

Pretty soon, you’ll start to see huge opportunities, just as he did.

Supernovas = Bubbles

top artificial intelligence stocks for 2021
© Millionaire Media, LLC

Penny stocks rise and fall in regular, predictable patterns.

You see, typically, a stock trades below $10 because it’s a garbage company with weak prospects.

Most are unprofitable and likely to go bankrupt or delist at some point.

Hence, we get sharp declines that follow any meaningful runs.

Take Helbiz Inc. (NASDAQ: HLBZ) for example.

Back in 2021, the stock rose from $6 to over $40 in a matter of weeks, only to crash back down to earth.

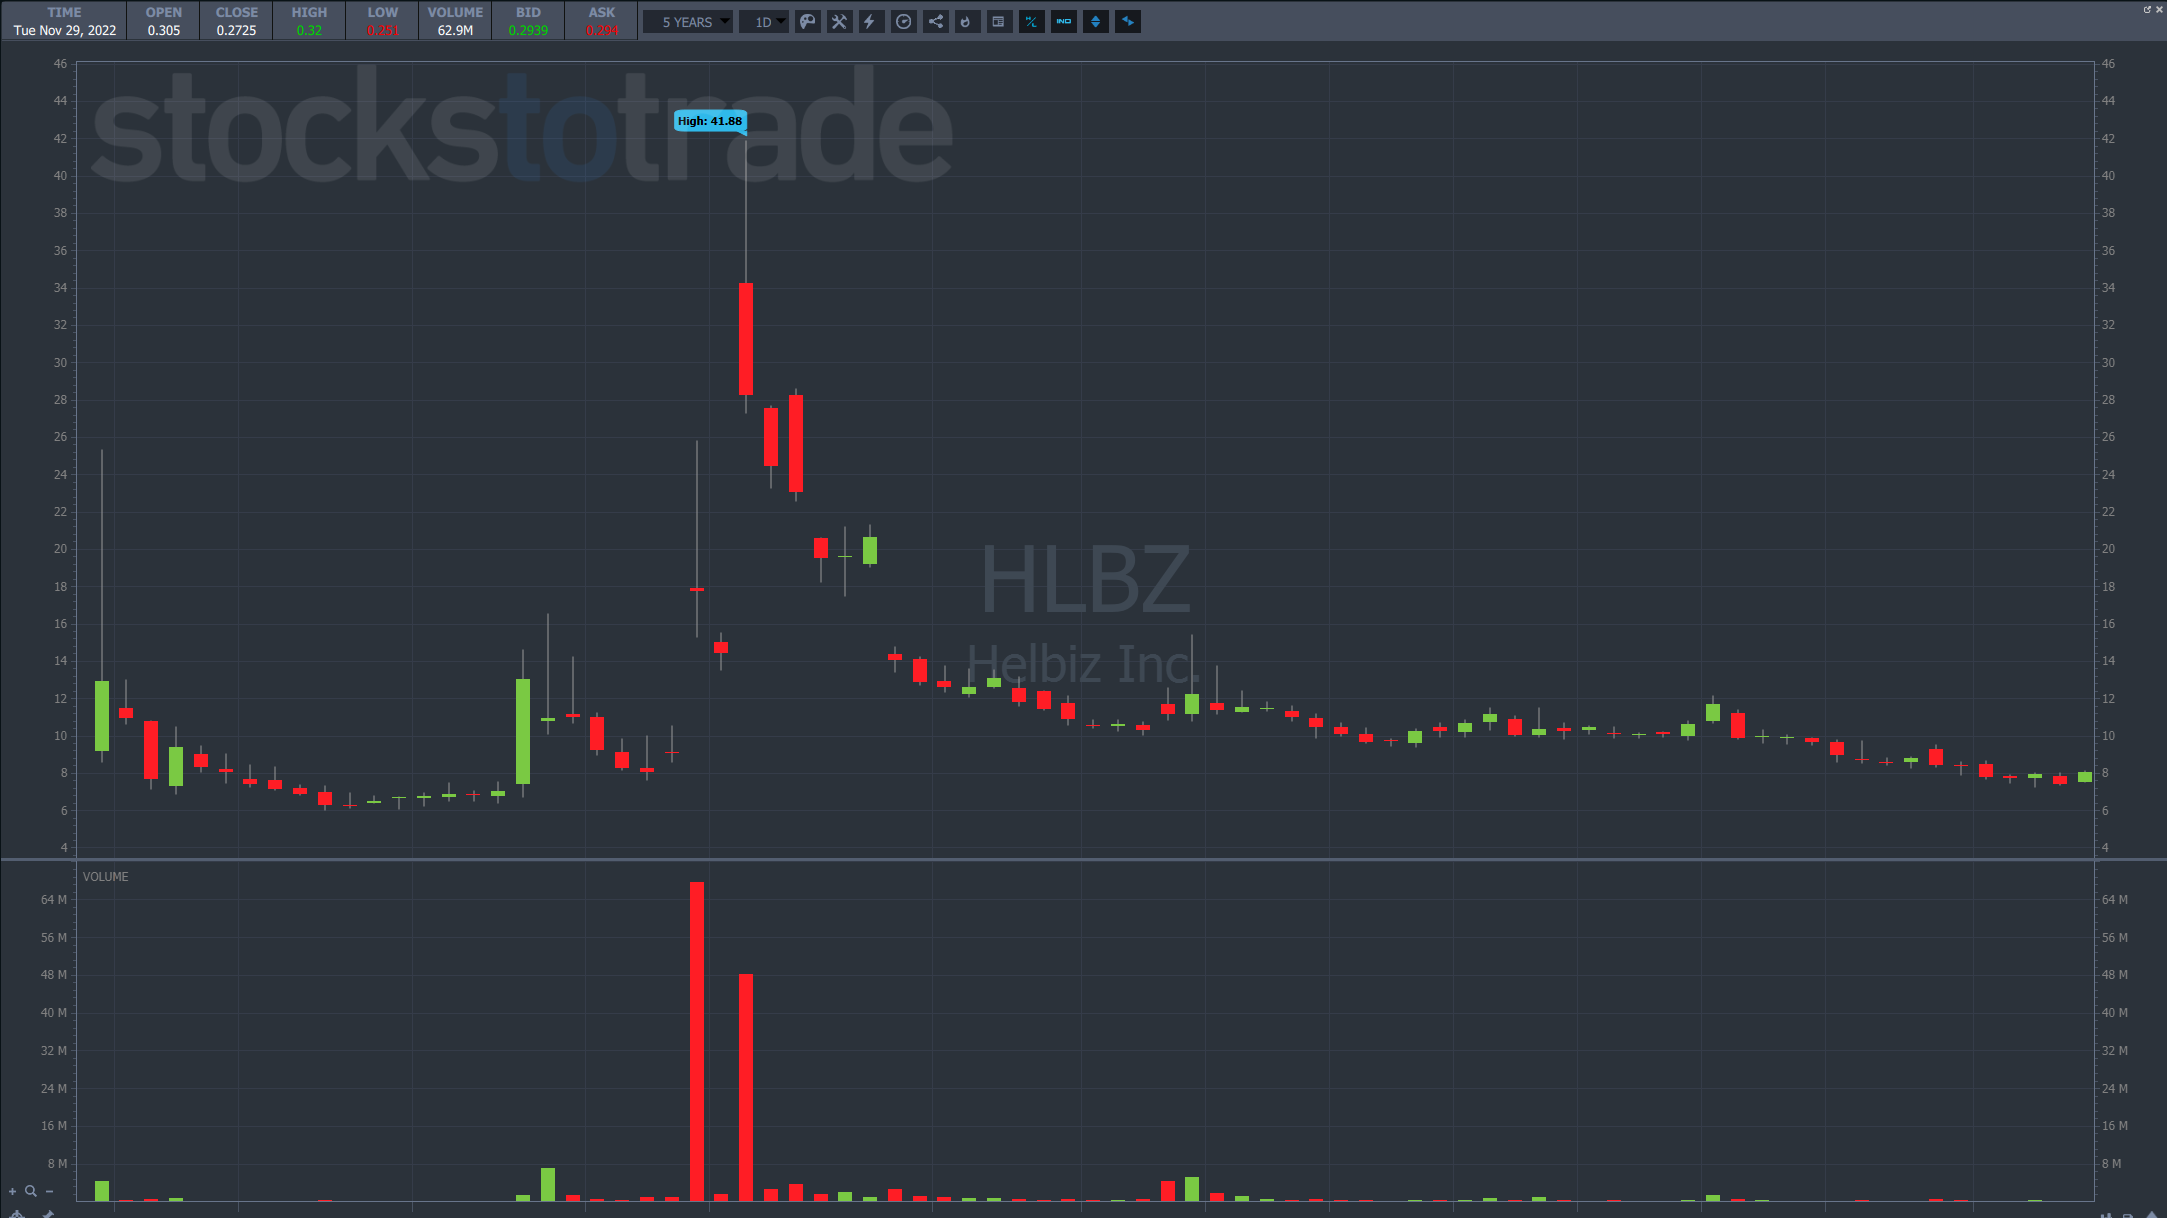
Today, it trades below $1.

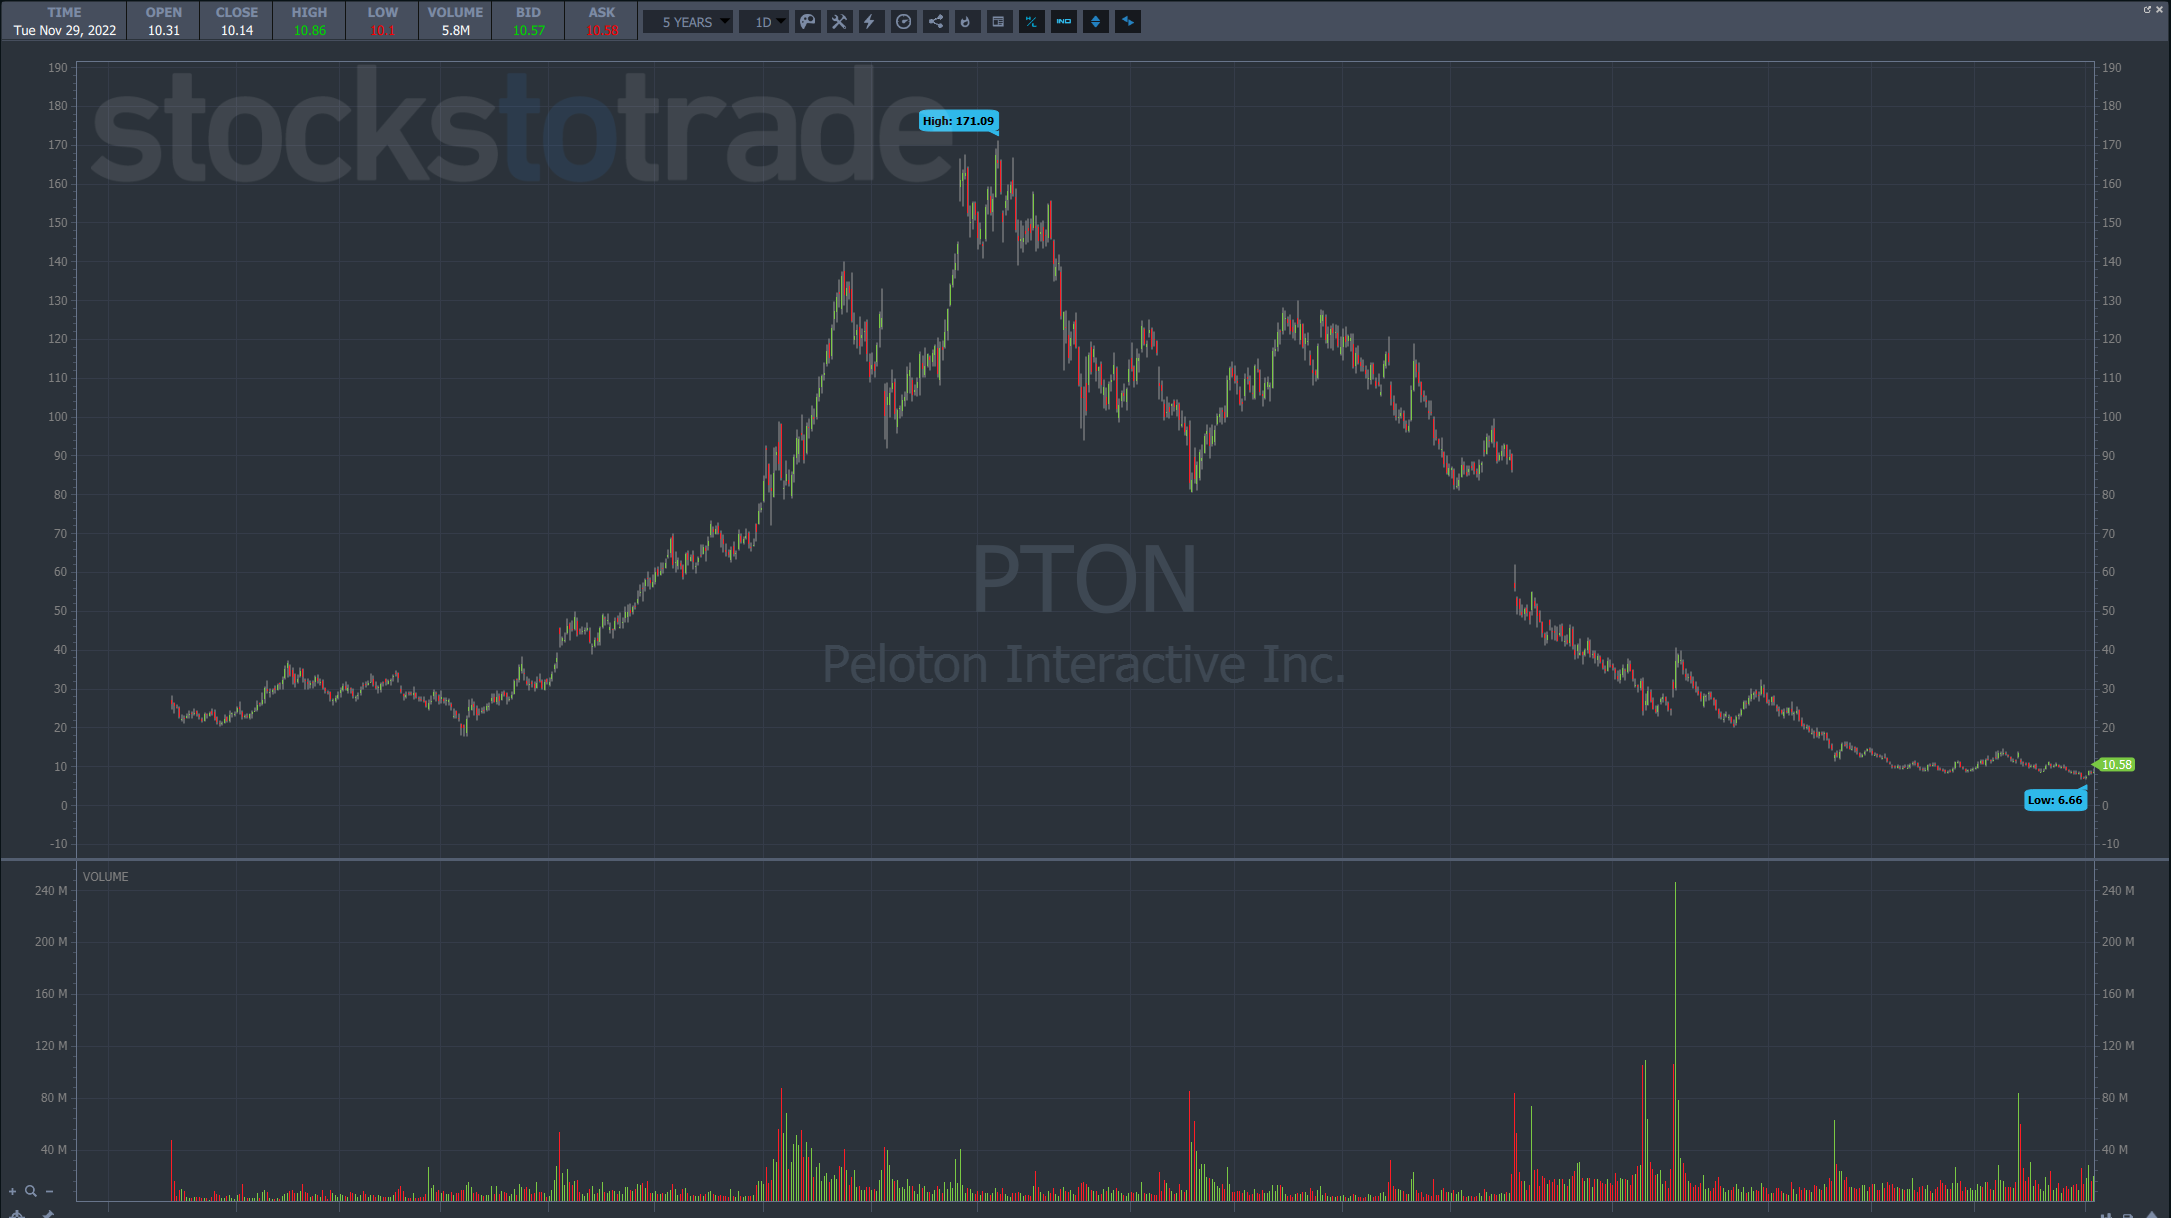
This same phenomenon happens with momentum stocks that look flashy and get a lot of press but don’t have solid businesses underneath.

Peloton is a perfect example.

The stock rose from $20 to $170 before crashing back down to $10.

Or how about Beyond Meat Inc. (NASDAQ: BYND), a company that was supposed to transform the way we eat?

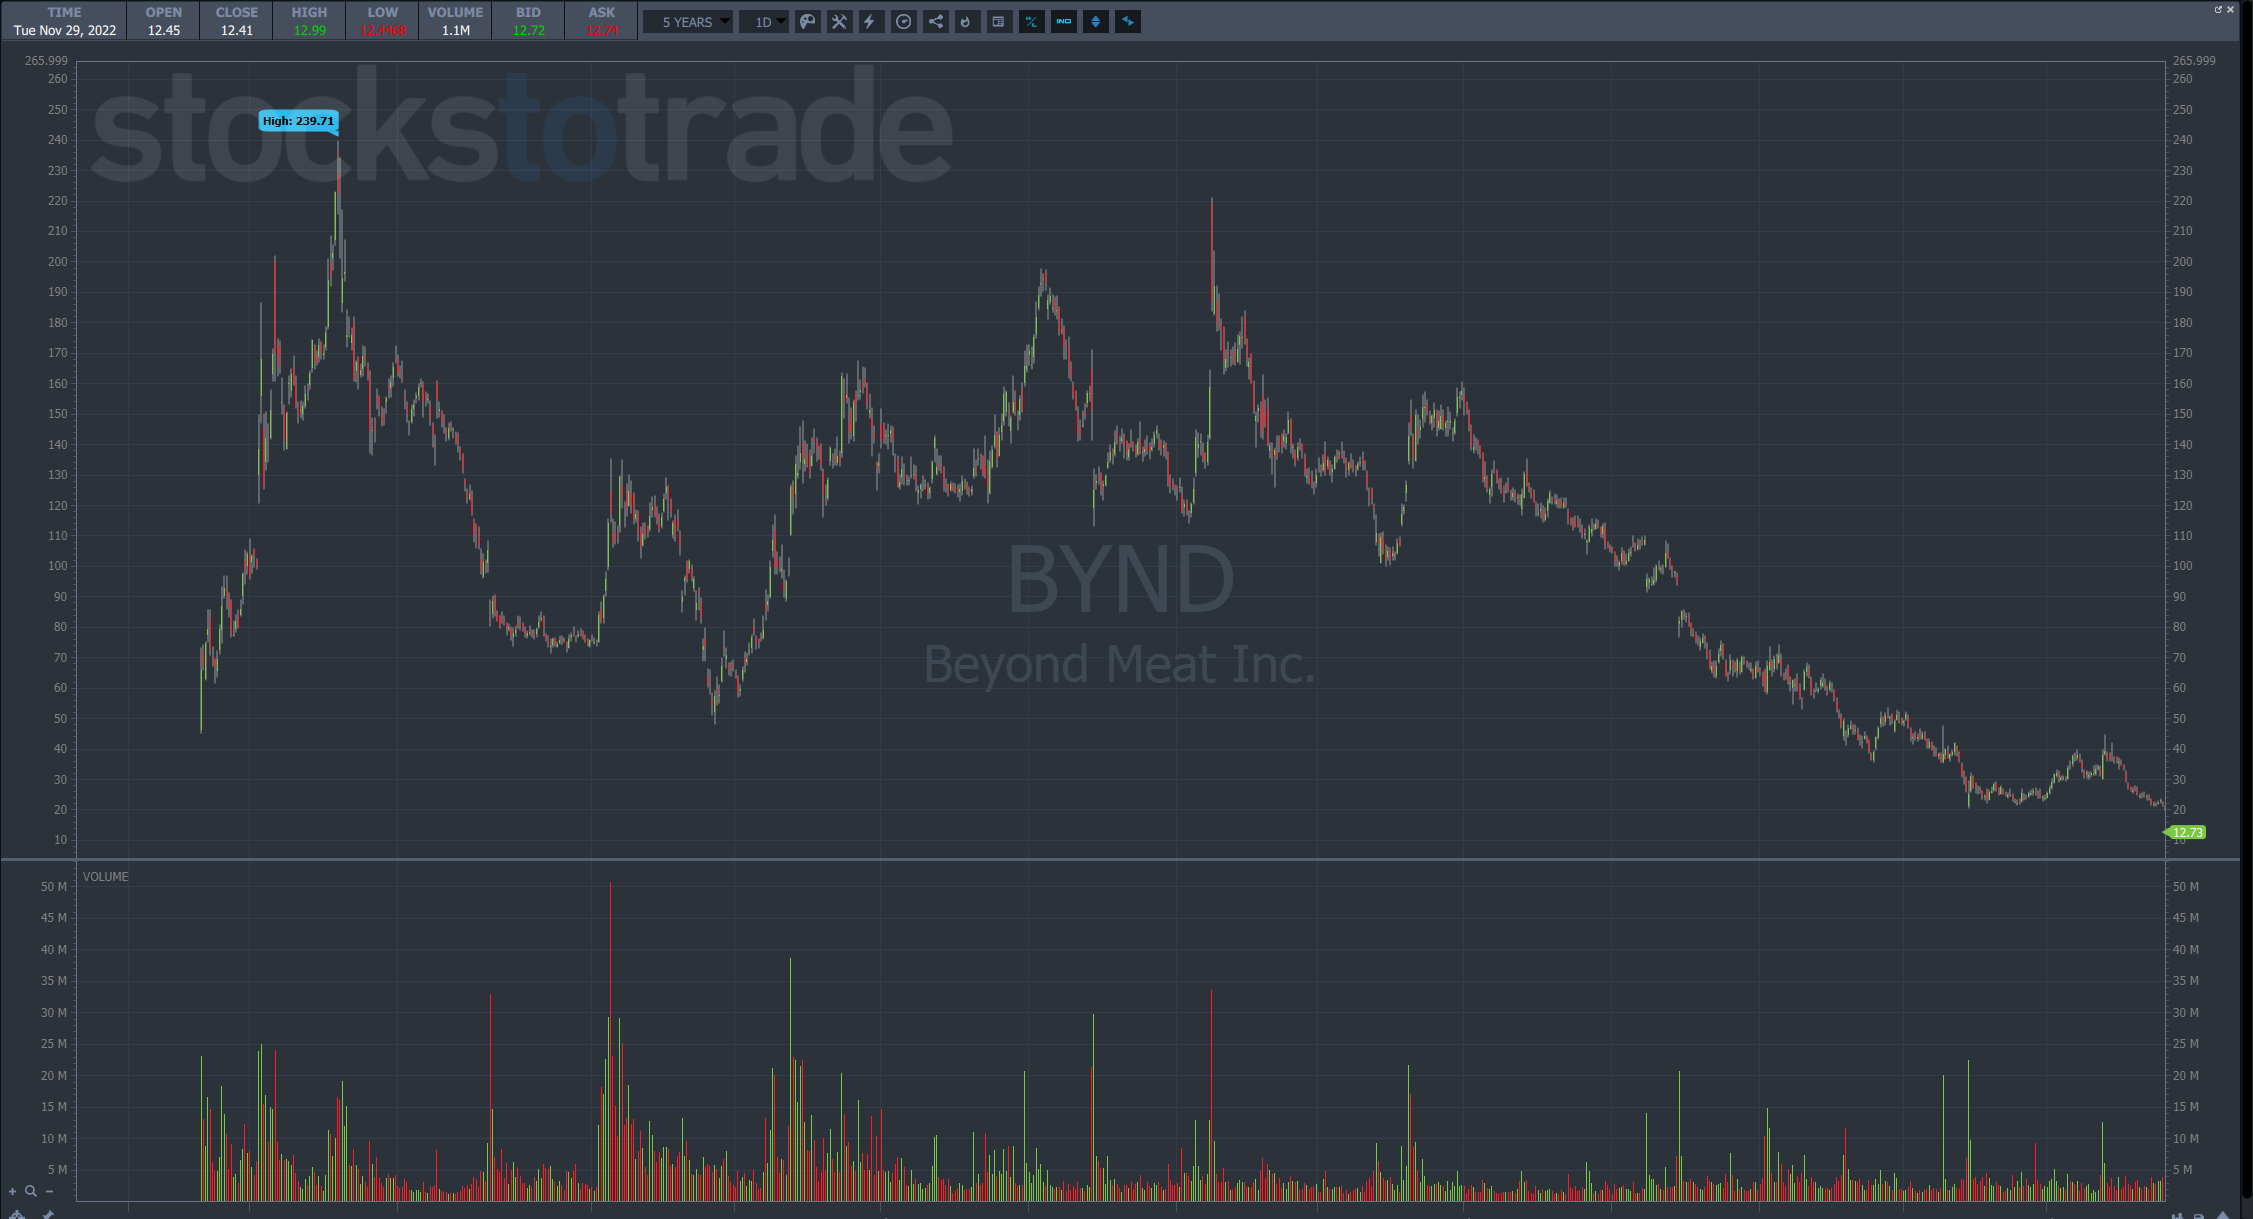
This stock went through several Supernova like events before fading into oblivion.

Bubbles happen all the time in the major markets.

The problem is trying to figure out when they’ll inflate and when they’ll pop.

To answer that, Mark turns to a simple theme that’s worked for nearly a decade.

Don’t Fight the Fed

© Millionaire Media, LLC

Central banks can juice stocks by adding liquidity and send them crashing when they remove liquidity.

In layman’s terms, low rates = bubbles form, high rates = bubbles pop.

Mark showed this in one simple graph in his presentation.

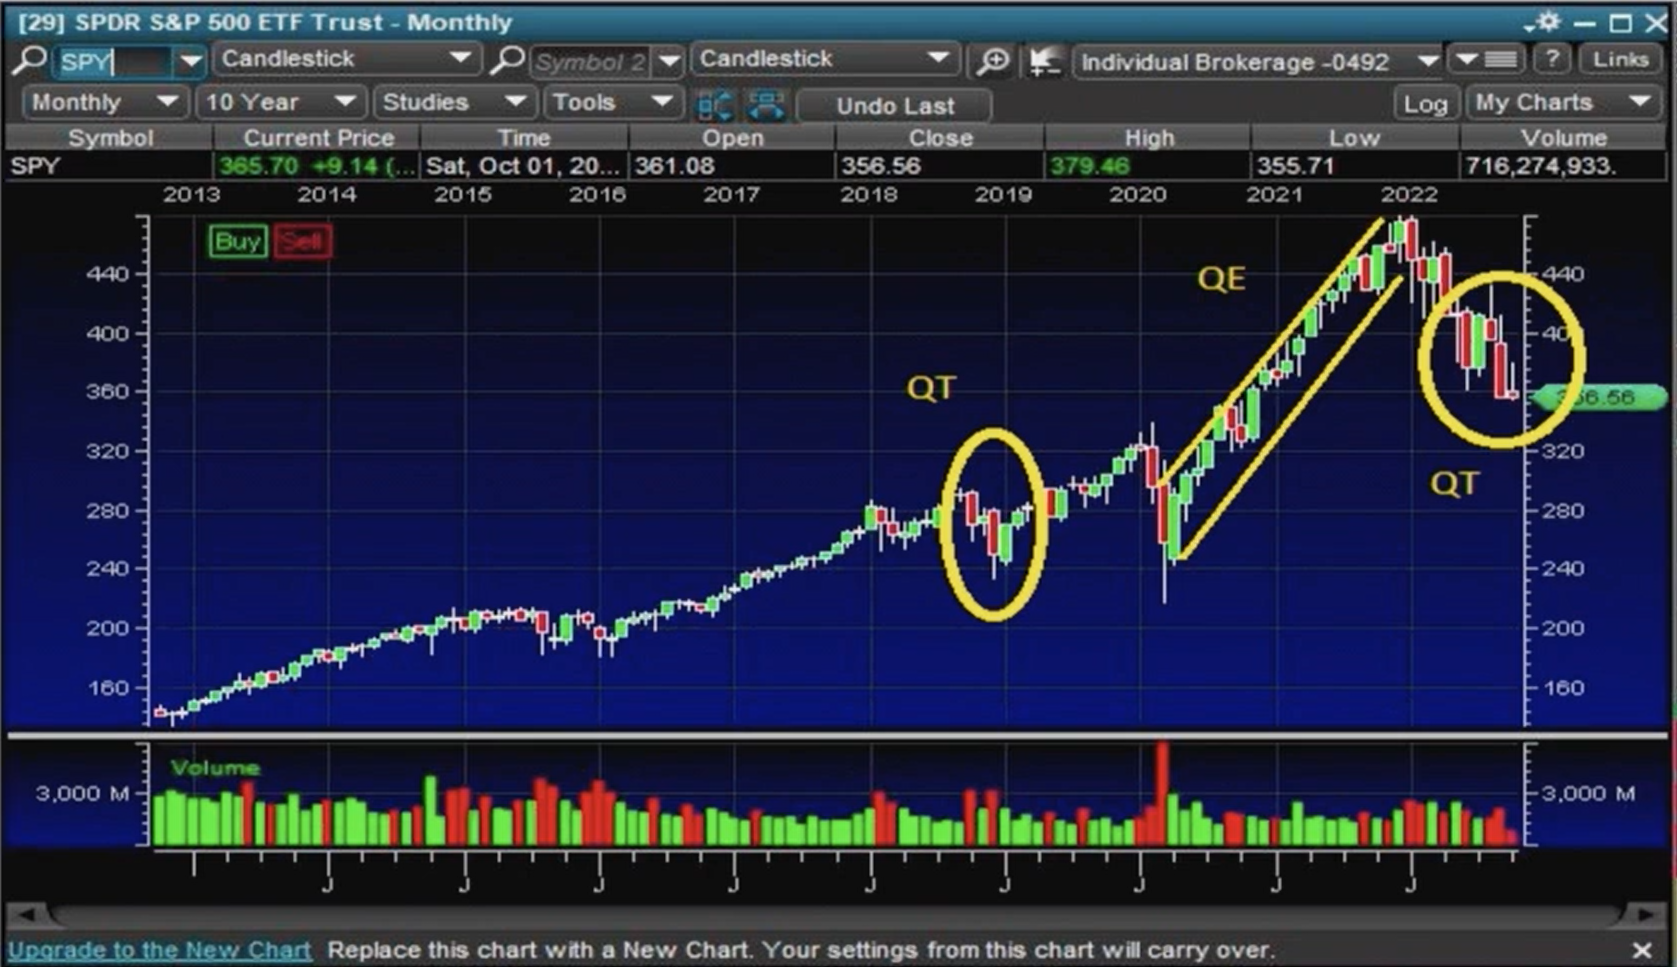
Every time the Federal Reserve tried to raise interest rates, stocks took a face plant.

We saw one of the loosest monetary policies hit during the pandemic, helping send stocks to the stratosphere.

With equities so far beyond normal, putting not just the brakes, but the truck in reverse has put immense pressure on equities.

That’s why everyone is so keen to watch the data points and hear what every Fed speaker has to say.

When the Fed raises rates, it pays to bet with the bears, which Mark does through put options.

When the Fed lowers rates, it pays to bet with the bears, which Mark does through call options.

In between, there are plenty of mini bubbles that occur.

But for the most part, once a stock the market has begun to sing its swan song, bubble stocks get obliterated.

You need look no further than Carvana (NYSE: CVNA), a favorite play that hit a high of $376.83 in September of last year.

Today, it trades below $10.

Penny Stocks vs. Large Caps

artificial intelligence stocks what to expect
© Millionaire Media, LLC

There are some key differences between penny stocks and large caps to keep in mind.

First, even the highest volatility large caps are nothing compared to penny stocks.

That’s why Mark relies on options to give him leverage and greater returns.

Second, the patterns take longer to play out in large caps than in penny stocks.

You won’t find a company like BYND up 50% in one day.

That takes weeks if not months to happen.

So when they crash, it’s also a bit slower of a process.

Now, this is just a taste of what’s out there.

But if you love the idea of trading options, then I strongly recommend you check out Mark’s Evolved Trader.

You can’t go wrong.

—Tim


How much has this post helped you?


Leave a reply


Author card Timothy Sykes picture

Timothy Sykes

Tim Sykes is a penny stock trader and teacher who became a self-made millionaire by the age of 22 by trading $12,415 of bar mitzvah money. After becoming disenchanted with the hedge fund world, he established the Tim Sykes Trading Challenge to teach aspiring traders how to follow his trading strategies. He’s been featured in a variety of media outlets including CNN, Larry King, Steve Harvey, Forbes, Men’s Journal, and more. He’s also an active philanthropist and environmental activist, a co-founder of Karmagawa, and has donated millions of dollars to charity. Read More

Post image

Get my weekly watchlist, free

Sign up to jump start your trading education!

* Results are not typical and will vary from person to person. Making money trading stocks takes time, dedication, and hard work. There are inherent risks involved with investing in the stock market, including the loss of your investment. Past performance in the market is not indicative of future results. Any investment is at your own risk. See Terms of Service here

The available research on day trading suggests that most active traders lose money. Fees and overtrading are major contributors to these losses.

A 2000 study called “Trading is Hazardous to Your Wealth: The Common Stock Investment Performance of Individual Investors” evaluated 66,465 U.S. households that held stocks from 1991 to 1996. The households that traded most averaged an 11.4% annual return during a period where the overall market gained 17.9%. These lower returns were attributed to overconfidence.

A 2014 paper (revised 2019) titled “Learning Fast or Slow?” analyzed the complete transaction history of the Taiwan Stock Exchange between 1992 and 2006. It looked at the ongoing performance of day traders in this sample, and found that 97% of day traders can expect to lose money from trading, and more than 90% of all day trading volume can be traced to investors who predictably lose money. Additionally, it tied the behavior of gamblers and drivers who get more speeding tickets to overtrading, and cited studies showing that legalized gambling has an inverse effect on trading volume.

A 2019 research study (revised 2020) called “Day Trading for a Living?” observed 19,646 Brazilian futures contract traders who started day trading from 2013 to 2015, and recorded two years of their trading activity. The study authors found that 97% of traders with more than 300 days actively trading lost money, and only 1.1% earned more than the Brazilian minimum wage ($16 USD per day). They hypothesized that the greater returns shown in previous studies did not differentiate between frequent day traders and those who traded rarely, and that more frequent trading activity decreases the chance of profitability.

These studies show the wide variance of the available data on day trading profitability. One thing that seems clear from the research is that most day traders lose money .

Millionaire Media 66 W Flagler St. Ste. 900 Miami, FL 33130 United States (888) 878-3621 This is for information purposes only as Millionaire Media LLC nor Timothy Sykes is registered as a securities broker-dealer or an investment adviser. No information herein is intended as securities brokerage, investment, tax, accounting or legal advice, as an offer or solicitation of an offer to sell or buy, or as an endorsement, recommendation or sponsorship of any company, security or fund. Millionaire Media LLC and Timothy Sykes cannot and does not assess, verify or guarantee the adequacy, accuracy or completeness of any information, the suitability or profitability of any particular investment, or the potential value of any investment or informational source. The reader bears responsibility for his/her own investment research and decisions, should seek the advice of a qualified securities professional before making any investment, and investigate and fully understand any and all risks before investing. Millionaire Media LLC and Timothy Sykes in no way warrants the solvency, financial condition, or investment advisability of any of the securities mentioned in communications or websites. In addition, Millionaire Media LLC and Timothy Sykes accepts no liability whatsoever for any direct or consequential loss arising from any use of this information. This information is not intended to be used as the sole basis of any investment decision, nor should it be construed as advice designed to meet the investment needs of any particular investor. Past performance is not necessarily indicative of future returns.

Citations for Disclaimer

Barber, Brad M. and Odean, Terrance, Trading is Hazardous to Your Wealth: The Common Stock Investment Performance of Individual Investors. Available at SSRN: “Day Trading for a Living?”

Barber, Brad M. and Lee, Yi-Tsung and Liu, Yu-Jane and Odean, Terrance and Zhang, Ke, Learning Fast or Slow? (May 28, 2019). Forthcoming: Review of Asset Pricing Studies, Available at SSRN: “https://ssrn.com/abstract=2535636”

Chague, Fernando and De-Losso, Rodrigo and Giovannetti, Bruno, Day Trading for a Living? (June 11, 2020). Available at SSRN: “https://ssrn.com/abstract=3423101”