After being on the move in Europe, Asia, and the Pacific for months, I finally made it back to Miami recently. Not for long, as you’ll see.
But I was able to make a difference while home…
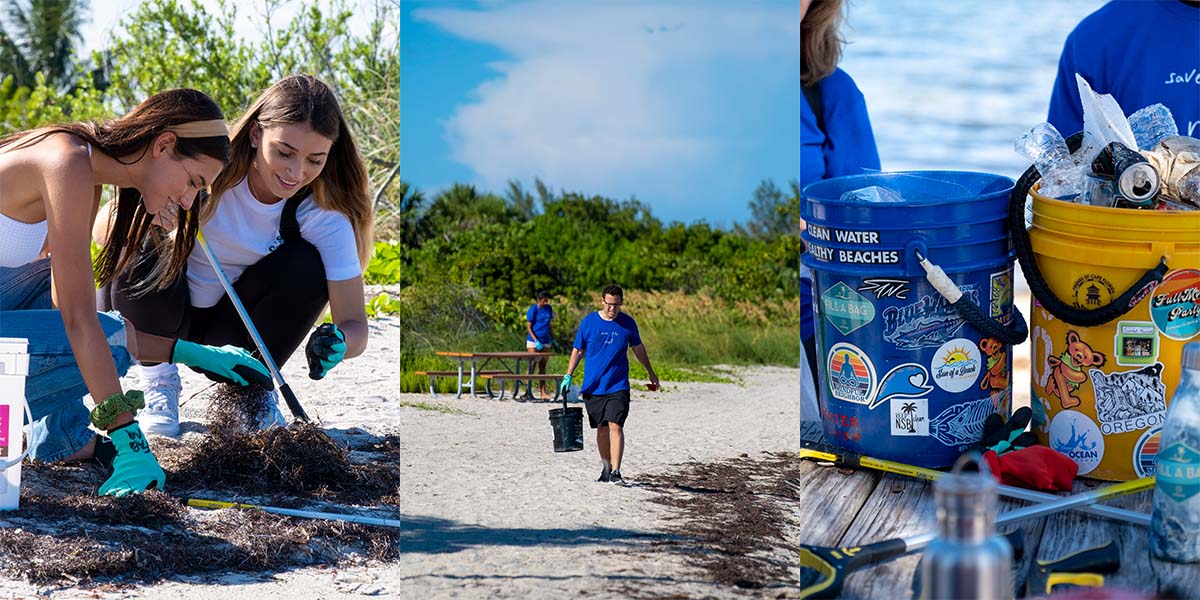
In keeping with my recent Save the Reef mission, we did a beach cleanup when I went back to Miami on July 16. Four students showed up to help, so that was cool. I want to extend a big thank you to those who managed to make it.

One student who showed up to help reported turning $9K into $145K since he’s been with me. I’m not able to verify his claim, but he did show me his account on his phone so I believe him.
If you’d like to learn to trade penny stocks using conservative, time-tested strategies…
… apply for the Trading Challenge today.
If you’ve been following me for a while you know I’m not one to just talk. When I get involved with issues like the plastic crisis in our oceans, I take action. The beach cleanup is just one example. I encourage you to take action as well.
Organize a cleanup near you. It could be at a nature reserve, nearby hiking trails, a beach, the banks of your local river, or even a park. Wherever you live, you can make a difference by organizing a cleanup. The more action each of us takes, the less plastic ends up in the ocean.
Speaking of plastic…
Have you heard of the crazy bottle cap challenge spreading across social media? If you know what I’m talking about…
… and you want to do something about single-use plastic…
… check this out: Huddie helped me take the bottle cap challenge when we met up in Santorini.
Here’s my take … the real bottle cap challenge:
Table of Contents
Get Your Karmagawa Gear

Karmagawa is the charity apparel brand Matt Abad and I started. We donate a huge percentage of profits to several charities. The rest goes to grow the brand so we can donate more.
We released a bunch of new ‘Save the Reef’ gear since the documentary. Get yours today and while you’re there, pick up a few gifts for friends and family. Help spread the word.
Whenever I get back to the U.S., my schedule is action-packed. As I write, I’m preparing to speak at the Traders Expo in Chicago. It’ll be over by the time you read this, but I’m pretty sure you can watch a replay of me and Tim Bohen giving our talk.
Also, since arriving back in the U.S. I’ve been teaching. We just did our first ever Midwest Meetup — I’ll tell you more about that in the next edition.
As always, I’ve been trading. Which brings me to…
Trading Lessons: the Truth About Preparation
Recently I’ve had a run of winning trades. Here’s the deal…
I’m on a run because I focus on the patterns that are working best for me.
I realize that sounds really simple and probably boring. But it’s the way I maximize my success.
Let’s use my best recent trade as an example…
Tautachrome, Inc. (OTCPK: TTCM)
Tautachrome is an IT company focused on smartphone apps and augmented reality. They have a platform called KlickZie that digitally tags smartphone pictures. The idea being it allows users to interact based on the digital tags. They employ blockchain technology for this.
Their latest release is an app called ARknet 1.0. They’re attempting to create the next big virtual reality game — kinda like Pokemon Go. They also plan to set a new Guinness World Record for the largest scavenger hunt on August 25. We’ll see how that pans out for them.
Take a look at the 1-year chart, and then I’ll explain the setup:
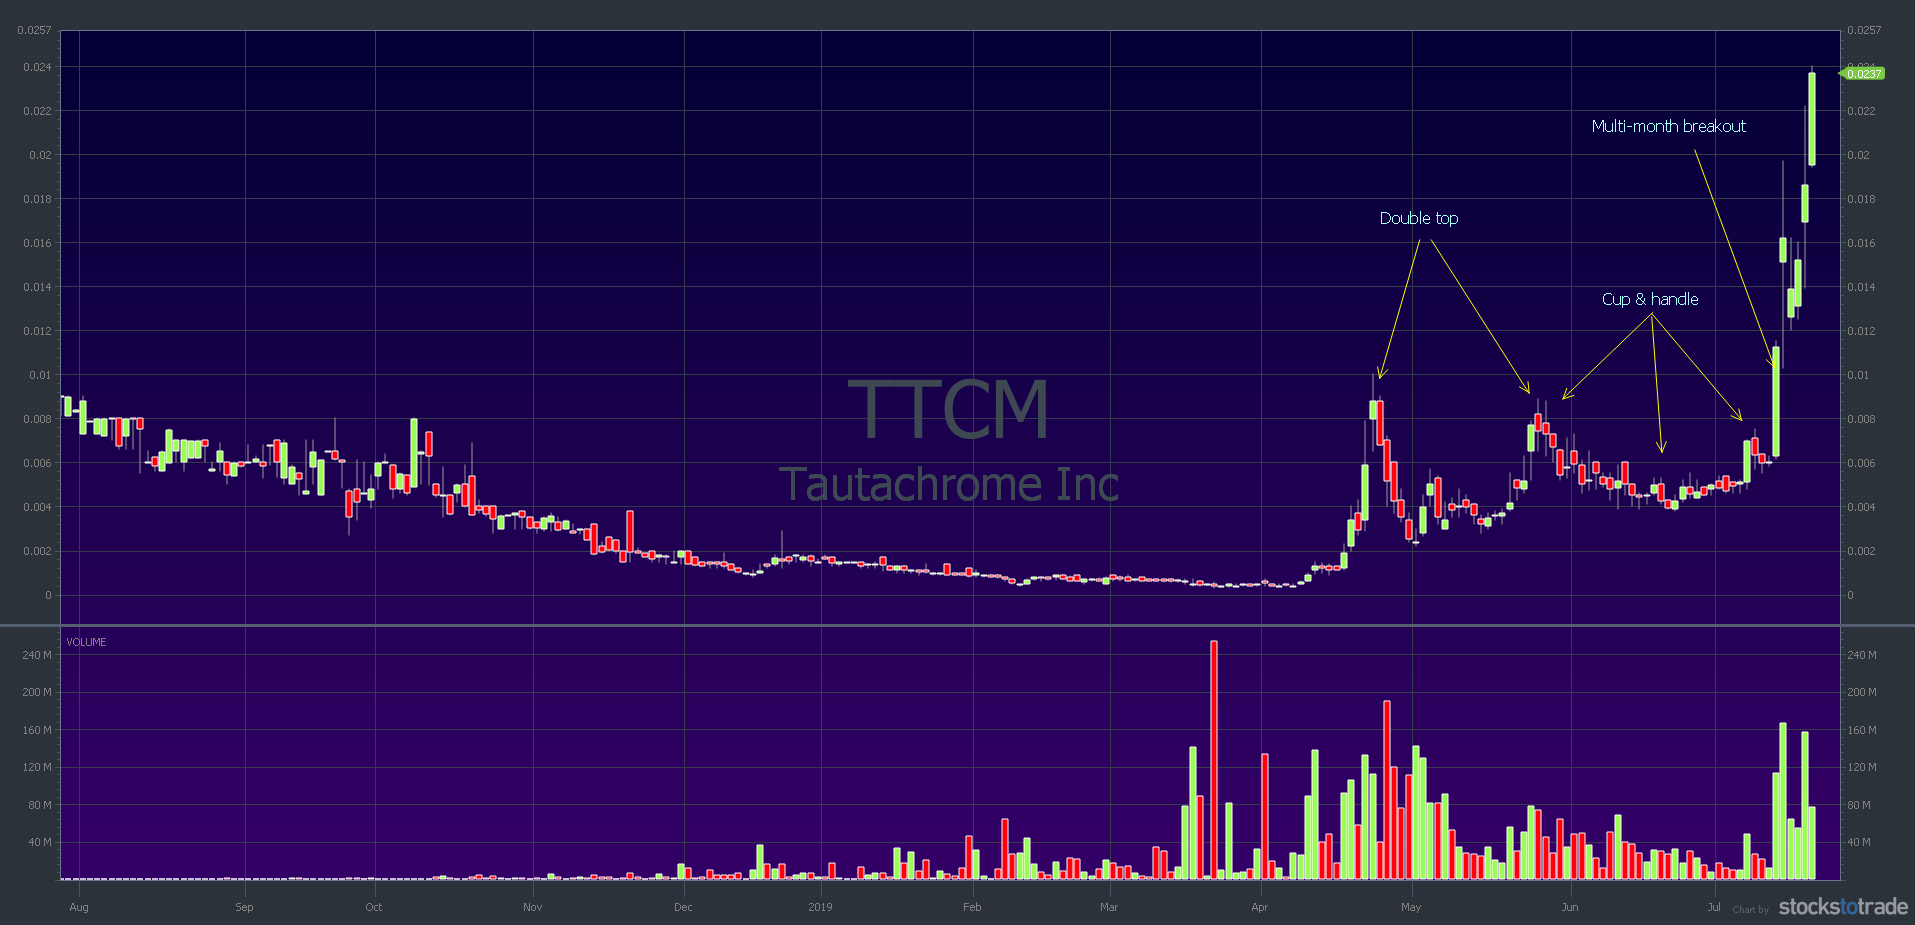
Notice the double top and failure on the TTCM chart. Then there was a 2-month consolidation period that formed a near-perfect cup and handle. Finally, there was a breakout over the previous high.
Also, TTCM has a history of multi-day spikes. In April, there were 5 days of upside. Then in May, the double top formed after 3 days of upside. The spike on July 12 was a massive first green day with volume.
The catalyst was a press release. It announced the public launch of their ARknet augmented reality app. They also announced a revenue generation model within the app. To top it off, the company announced a 500 million reduction in the authorized share count.
In other words, this trade had several positive indicators. Even so, that doesn’t explain why it was a near-perfect setup for me. Check it out…
- TTCM was a perfect multi-month breakout.
- It’s an OTC stock — which I like.
- It was trading huge volume relative to its history.
- It had a strong catalyst — the stock was popping on the debut of their app.
- It’s a ‘hot’ technology — virtual reality is in the news a lot recently.
- The time of day was perfect for me and my schedule. I like buying first green days near the end of the day.
- I was able to lock in profits and reduce my risk near the market close.
- I kept a speculative position over the weekend with the thesis it would gap up on Monday morning.
What would have made TTCM perfect? Price. It’s a super-low-priced stock. I usually don’t like to trade sub-penny stocks. I wish it was trading around 10 or 20 cents a share to start. Then I would have held a larger position over the weekend.
Still, this was one of my best trades of the year. It’s important for you to understand that every time this kind of pattern comes around, I’m prepared. The sad thing is that most newbies are unprepared. They don’t see it, and they don’t trade it…
… if the perfect play hit them in the head tomorrow they would just keep walking.
That reminds me of a famous quote:
“Men occasionally stumble over the truth, but most of them pick themselves up and hurry off as if nothing had happened.” — Winston Churchill
OK, now you’ve seen the setup, and you know my thoughts going in. Now let’s look at the trade. Please study this trade. Much of my success comes from playing a waiting game. I wait for the indicators to line up before I risk my hard-earned money. I explain the seven indicators in detail in my Trader Checklist Part Deux DVD.
If you’re serious about learning to trade, apply for the Trading Challenge today.
Here’s the chart from July 12–15 when I was in the trade:
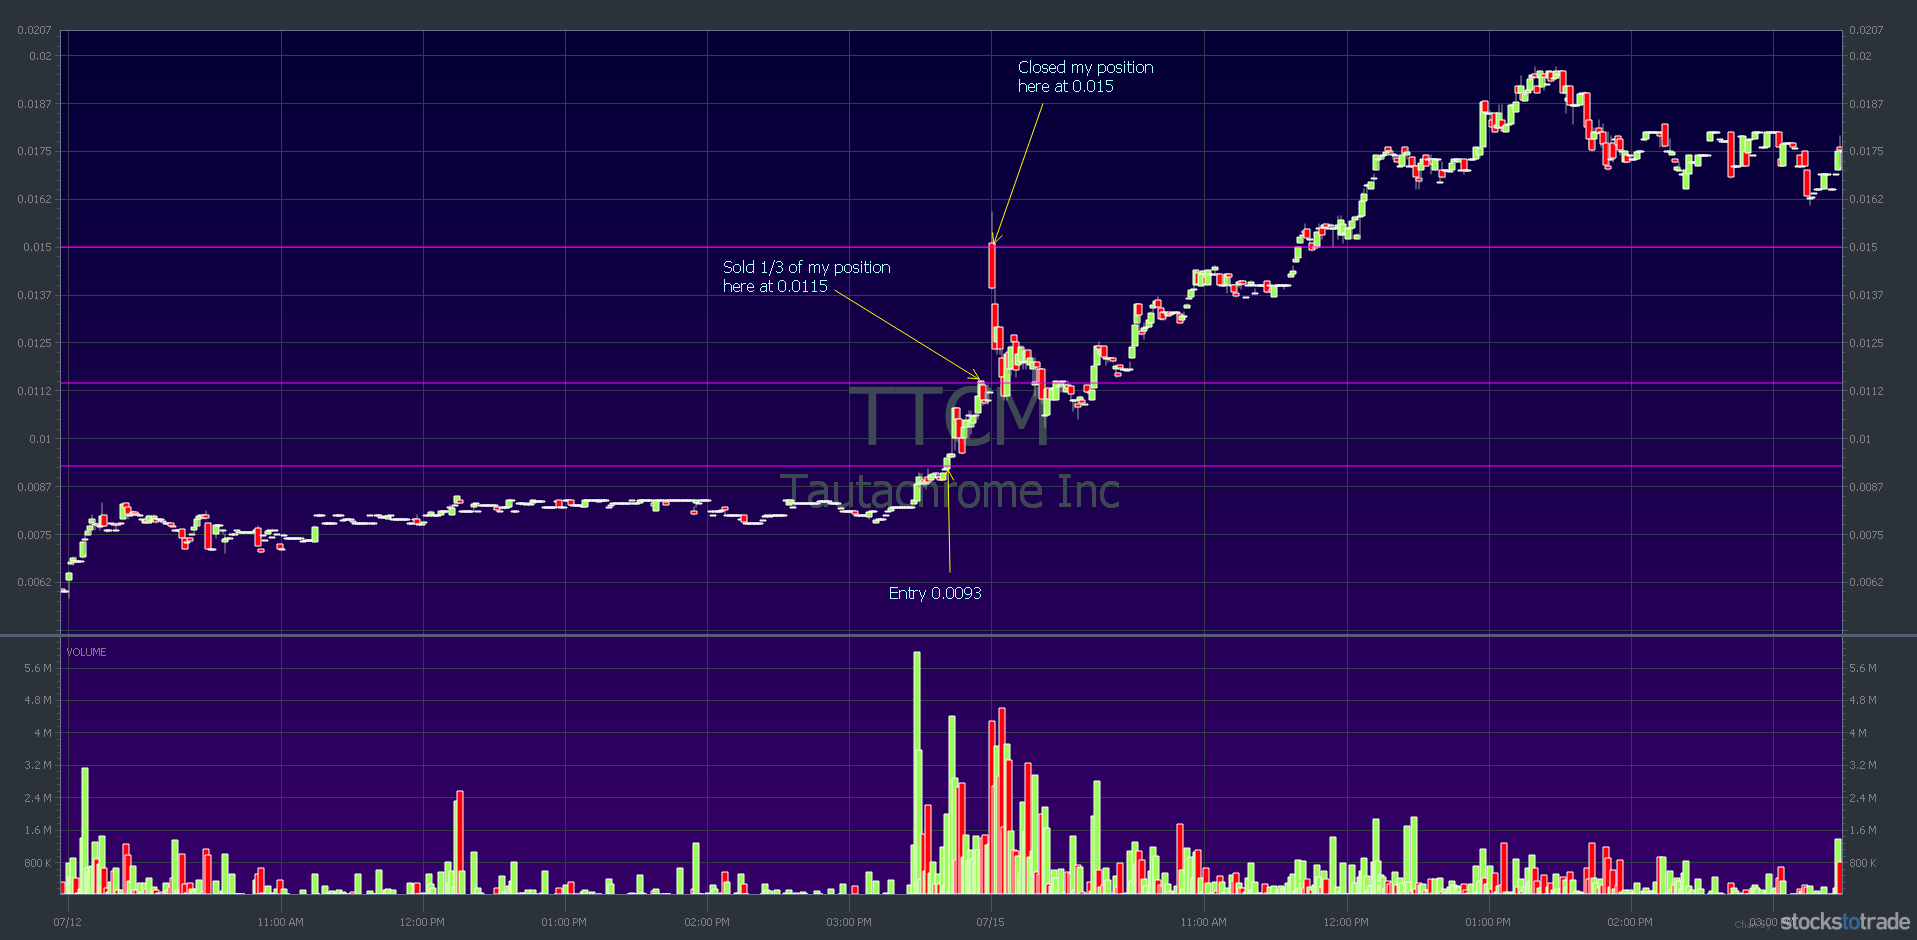
Notice my entry point was after the stock had been consolidating all day from its morning spike? Volume picked up in the power hour from 3–4 p.m. I bought roughly 20 minutes before the market closed.
Even though my exposure was small in dollar terms, I wasn’t comfortable holding 750,000 shares over the weekend. So, I pruned my position by selling 250,000 shares into the awesome strength near the market close. Not only can that reduce risk, but also potentially lock in some profits.
Then, when the market opened on Monday there was a MASSIVE gap up. That can happen when the news catalyst spreads over the weekend. It was nice to sell into that. I managed an overall gain of 48.39% on this trade for a $3,375 profit.*
I have to give kudos to the Trading Challenge chat room for this trade. I don’t remember who first alerted it but I found it from the chat room — which is pretty cool. It goes to show how hard some students study and how well they pay attention.
Now it’s time for…
Trading Questions from Students
“When considering volume versus float, how important is float rotation? Is it enough to see a big increase over average volume given other indicators or criteria are positive?”
Before I answer, let me explain volume versus float. I teach students to trade stocks with high enough volume and volatility that they won’t get stuck in a trade. There has to be enough shares traded to get into and out of your positions easily.
Second, float rotation is when the entire float gets traded within the day. For example, if a stock with a 2 million share float trades 6 million shares, the float has rotated three times.
Now you know what the question means, here’s my answer…
I don’t like trading overly liquid stocks. For example, if a stock trades 20, 30, 50, or even 100 million shares a day it’s usually too much for me. That’s because it leads to choppy stocks and I get scared out of the trade and cut my losses — or profits.
Mind you, in the TTCM trade I explained above, the stock traded 113.02 million shares on July 12. It also has a float of 2.55 billion shares — which is NOT low float. It gives you a clue as to why it’s such a low-priced stock. So, this isn’t a perfect science. Sometimes certain indicators outweigh others.
Back to volume versus float…
For example, say I’m in a stock trading at $2 or $3 a share. I would cut my losses at 10 or 15 cents a share. That big a drop would be a red flag for me. Thing is, that’s just part of the choppiness of some of these huge liquid stocks.
At the same time, if a stock rotates its float 2, 3, or 4 times, it often keeps going. Why? Because there’s not enough supply to meet the huge demand. That’s why you see a lot of these 50%, 100%, and even 200% spikers recently. Especially with all these shorts getting squeezed.
“At what point in a spike do you consider a stock overextended? Is it based on percentage increase, price history, or something else?”
All the above. As an example, let’s go back to TTCM — but we’ll use a different trade. (I traded TTCM three times during its run.)
On July 18, I anticipated an afternoon breakout and bought at $0.0199. I sold roughly an hour later at $0.0217. It ran all the way to $0.0222 — 12% above the previous high of $0.0197 on July 15.
It’s tough for me to chase a stock that’s up over 10% or 15%. If the breakout fails and it comes back to support, that would be a 10% loss, which is too much for me. So for me, I don’t like chasing breakouts. Anything like 10%, 15%, or 20% above the breakout level is chasing. I prefer to buy right at the breakout and sell into strength.
Also, I’m not comfortable trading three, four, and five days into a run-up.
Take a look at the TTCM chart that shows where I bought and sold on July 18:
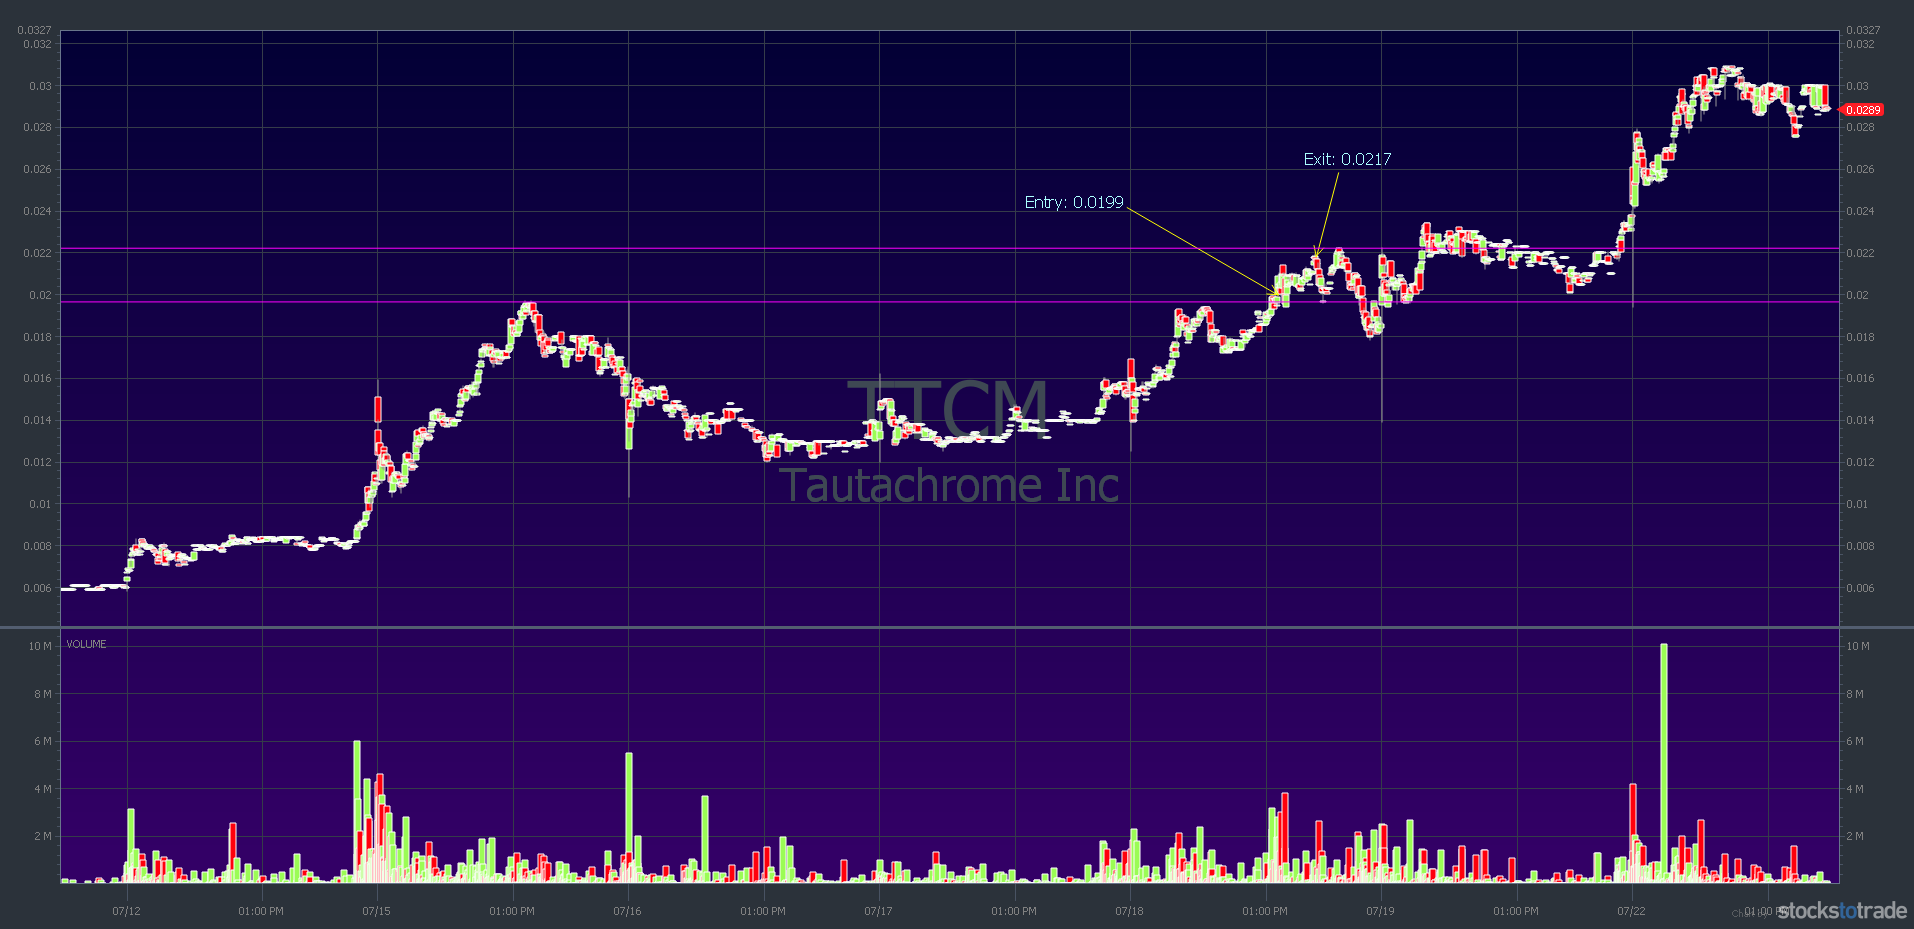
The pink lines show the breakout level of $0.0197 and the high-of-day (HOD) on July 18, which was $0.0222. On this particular trade, I managed to anticipate the breakout. Sometimes I don’t even wait for the breakout because it moves so fast once it happens.
A couple of things to note about this trade in relation to the question:
- I took a smaller position size than my July 12 trade. That’s because it was day five of the run.
- The stock was up 111% from my initial buy on July 12. So, I bought the breakout but I changed the way I traded based on my Sykes Sliding Scale indicators. I was more conservative and happy to take a much smaller 9.05% gain.
Here’s one final thing to consider when a stock is spiking…
If a stock breaks out, say 20%, and comes back to the breakout point and holds…
… it might be a good dip-buy.
Theoretically, the breakout would be confirmed. Then you’d have 20% of upside with the breakout point becoming support. So this can affect whether you consider the stock overextended.
Millionaire Mentor Market Wrap: Back to Miami
That’s another one in the books.
If you haven’t got your tickets for my Trader & Investor Summit in Orlando September 20–23 do it now. The early-bird pricing has been extended through July 29, but the event sells out every year. Don’t miss out on this potentially life-changing event.
Are you a trader? How do you prepare for your perfect trade setups? What steps do you take to develop the patience to wait for the right setup? Comment below — I love to hear from all my readers!

Leave a reply