timothy sykes logo

Trading Tips-Tim Sykes Penny Stock

How To Identify Trades Before Everyone Else

Timothy SykesAvatar
Written by Timothy Sykes
Updated 12/8/2022 6 min read

Right now is one of the BEST times to trade in 2022.

There’s a seasonal phenomenon at work I like to call the Winter Glitch.

And it’s creating so many potential plays that I have to remind my students and myself this isn’t Pokemon…

You don’t have to catch them all.

In fact, all you need is a handful of high-quality charts to find all the setups you need.

That’s EXACTLY how I called out my Wednesday trade in Global Developments Inc. (OTC: GDVM) nearly 24 hours prior.

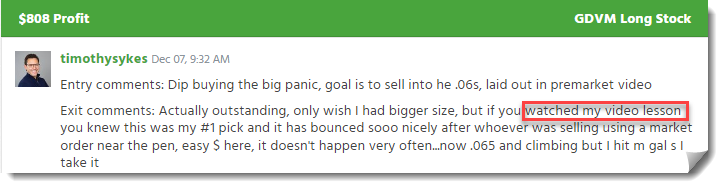
All my trades are posted for EVERYONE RIGHT HERE.

The earlier you can identify potential setups, the easier and more robust your prep work becomes.

That’s why I want to take you through each step in my process…

From identifying the setup to execution…

So you know what to look for as stocks progress through my 7-Step Penny Stock Framework.

Seasonal Selection

sykes sliding scale
© Millionaire Media, LLC

Some markets are for earning and some are for learning.

2021 was an earning market.

With meme stocks popping off left and right, there were dozens of penny stock multi-date runners to choose from.

That all evaporated in 2022.

Only recently, as we enter the ‘Winter Glitch’months, has the tide shifted.

In the last several weeks, several names went Supernova, from Cloudweb Inc. (OTC: CLOW) to Meta Materials (OTC: MMTLP).

Those who studied my 7-Step Penny Stock Framework had the blueprints for what to expect.

You might wondering, is it just the number of multi-day runners that makes this such a great seasonal trading period?

Yes, but also, it’s their quality.

Stocks can go Supernova and not provide a decent setup.

AMTD Digital Inc. (NYSE: HKD) is a great example.

Yet, as you’ll see in a moment, one stock can provide multiple trades over weeks during the different phases of the framework.

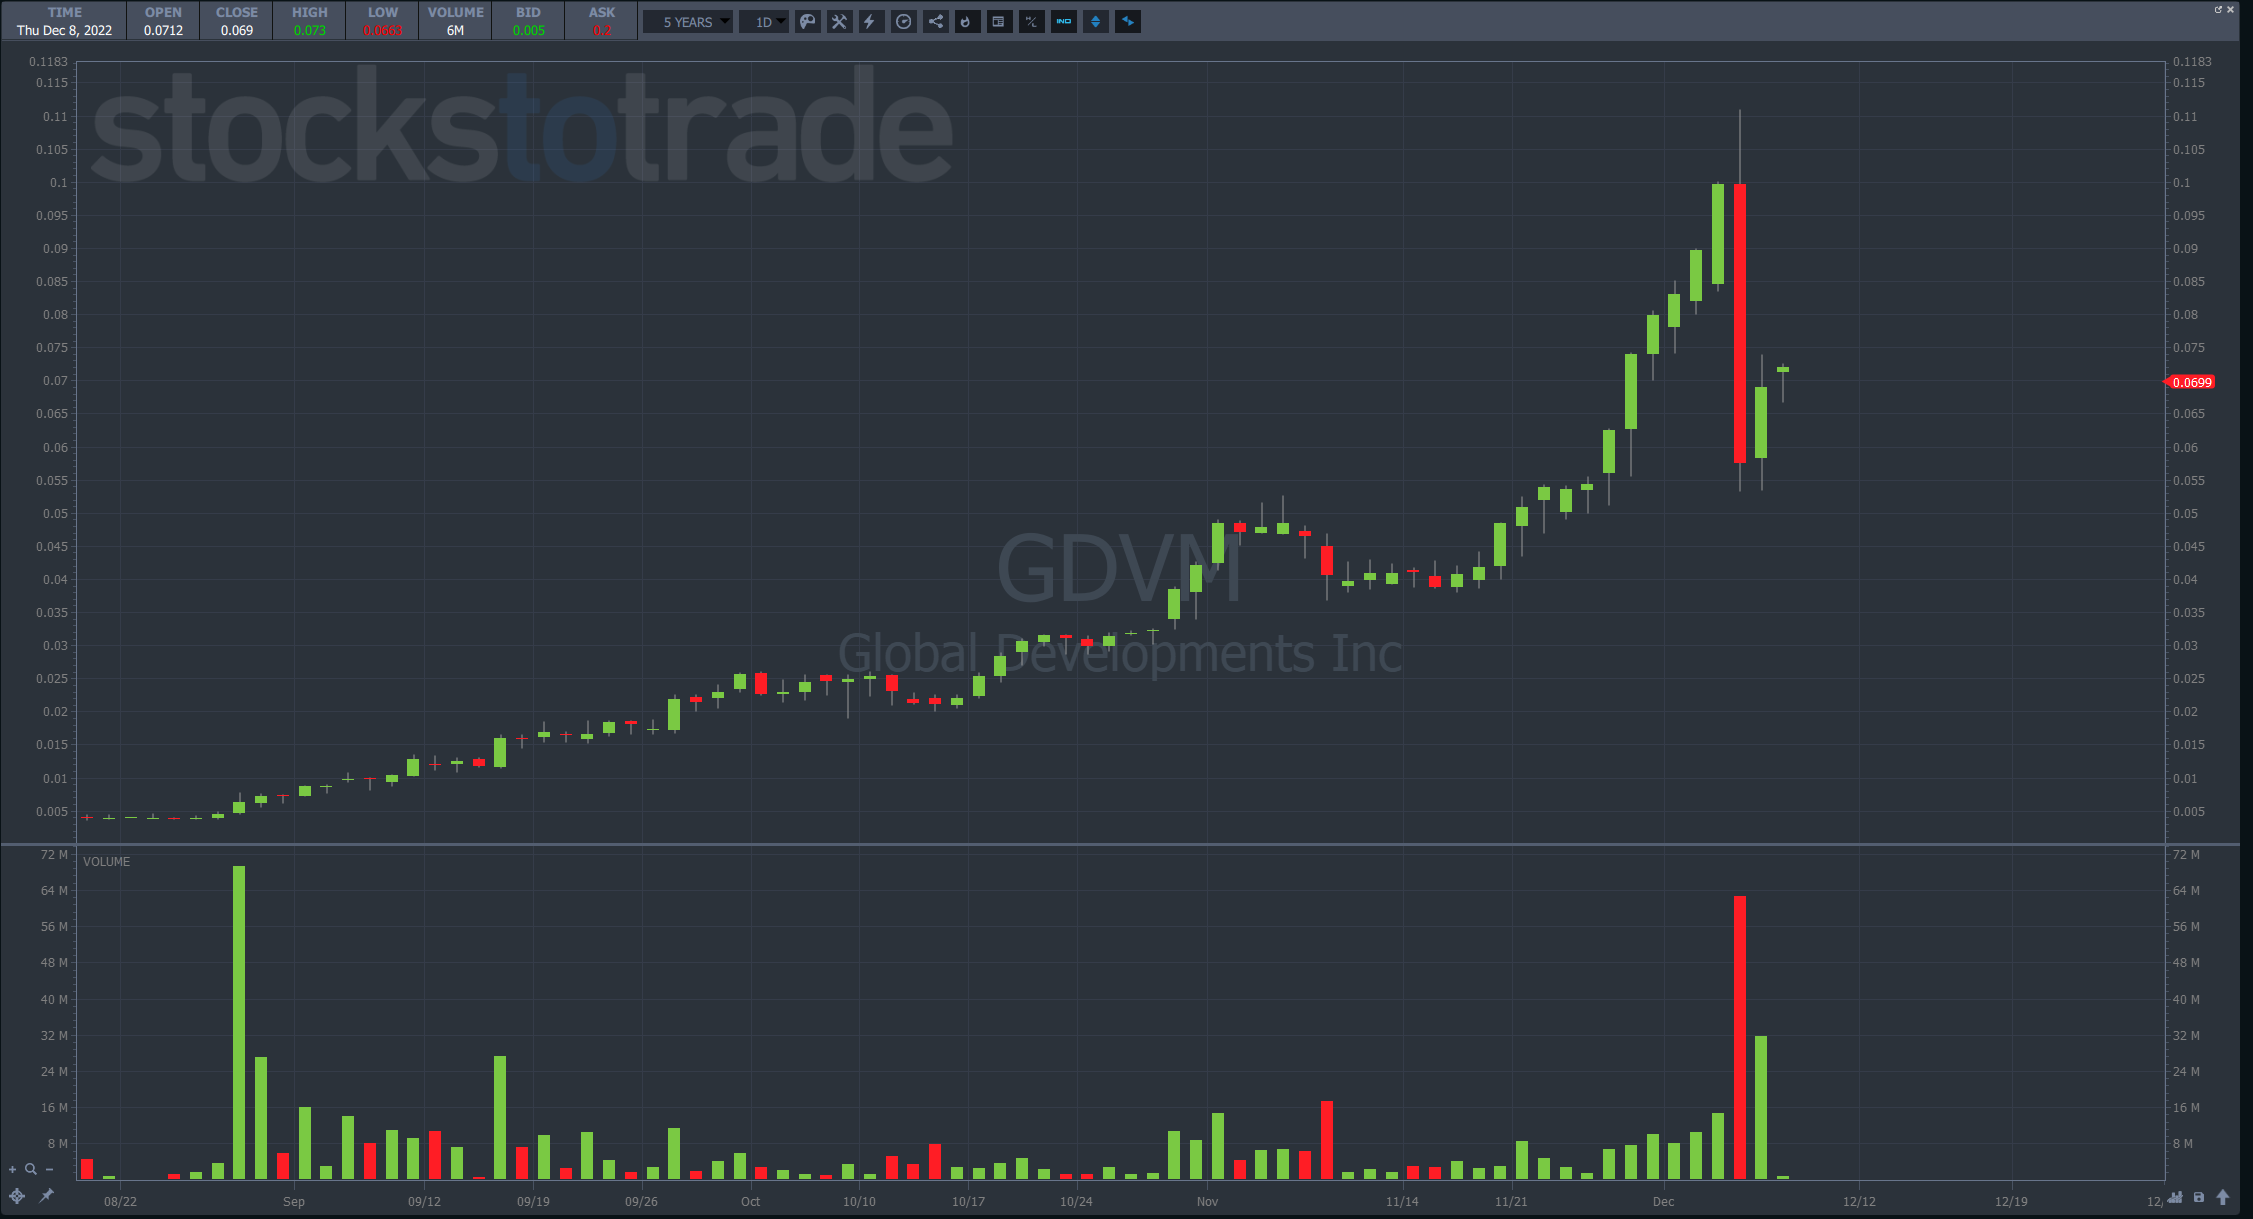
Before I dive into the details, take a look at the daily chart for GDVM and see if you can’t identify the different phases from the framework.

Tuesday’s Preparation

The chart above clearly says GDVM is a multi-month runner.

It’s one of the strongest OTC stocks that’s steadily climbed since late August.

On Tuesday, GDVM traded well for most of the day. It wasn’t until just before 3:30 p.m. that it completely fell apart.

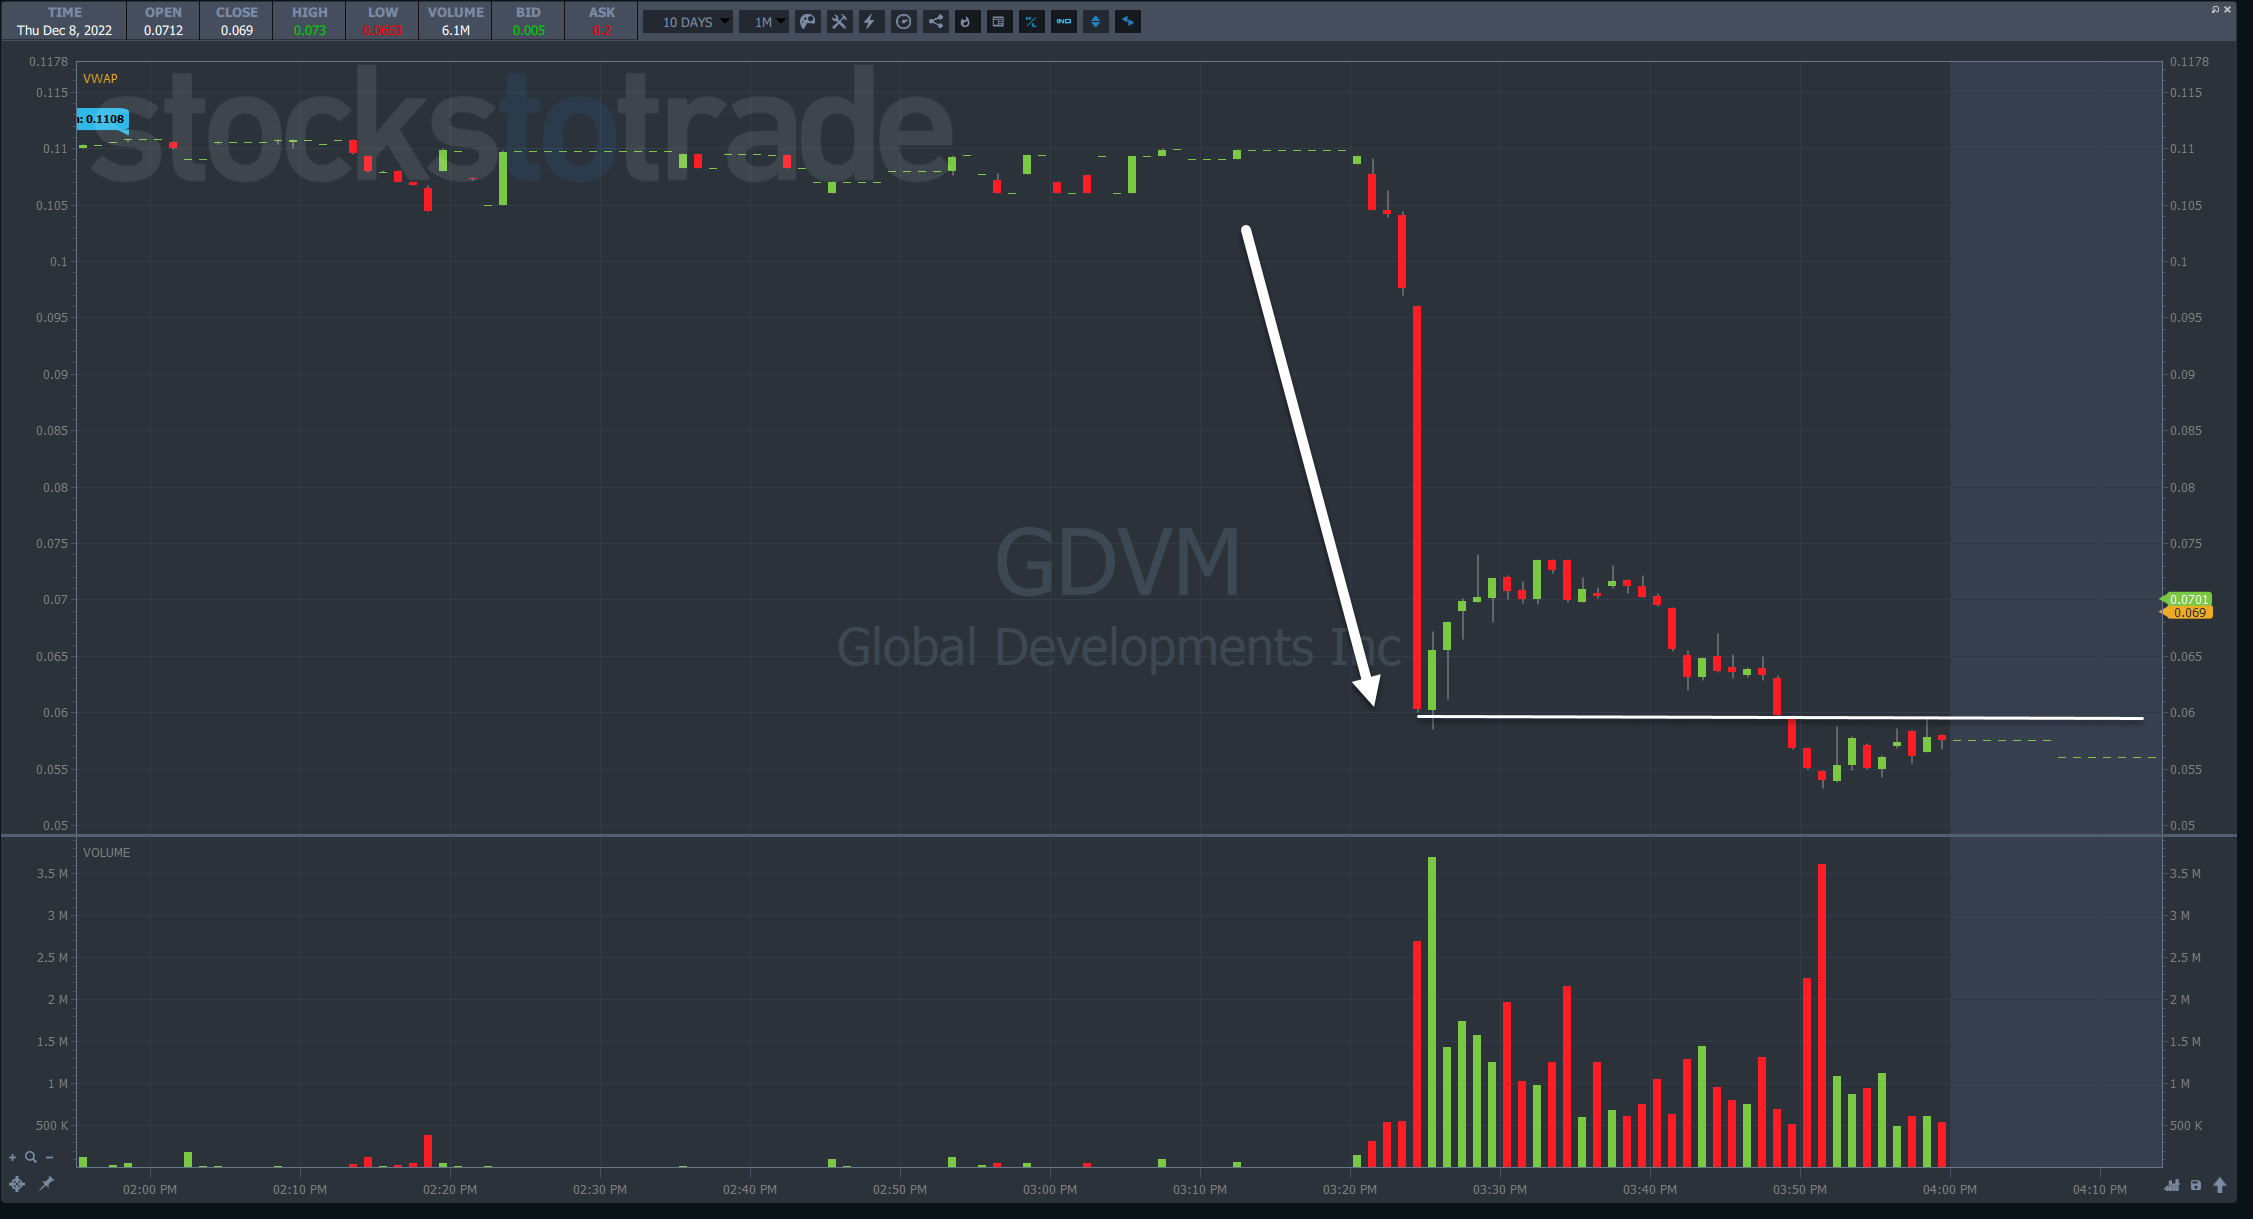
Shares plummeted in minutes from $0.11 to $0.06, a nearly 50% drop.

The initial question to ask is was there a panic dip buy opportunity?

If I was completely disciplined, then no. I would only panic dip buy in the morning.

However, since this was the first major red candle in months, it sometimes gets a decent bounce off the first crack.

And if you were fast enough, the green candle with the largest volume of the day could have been a nice entry for a small run higher…by small I mean $0.065 to $0.07-$0.073, which is still 5%-10%.

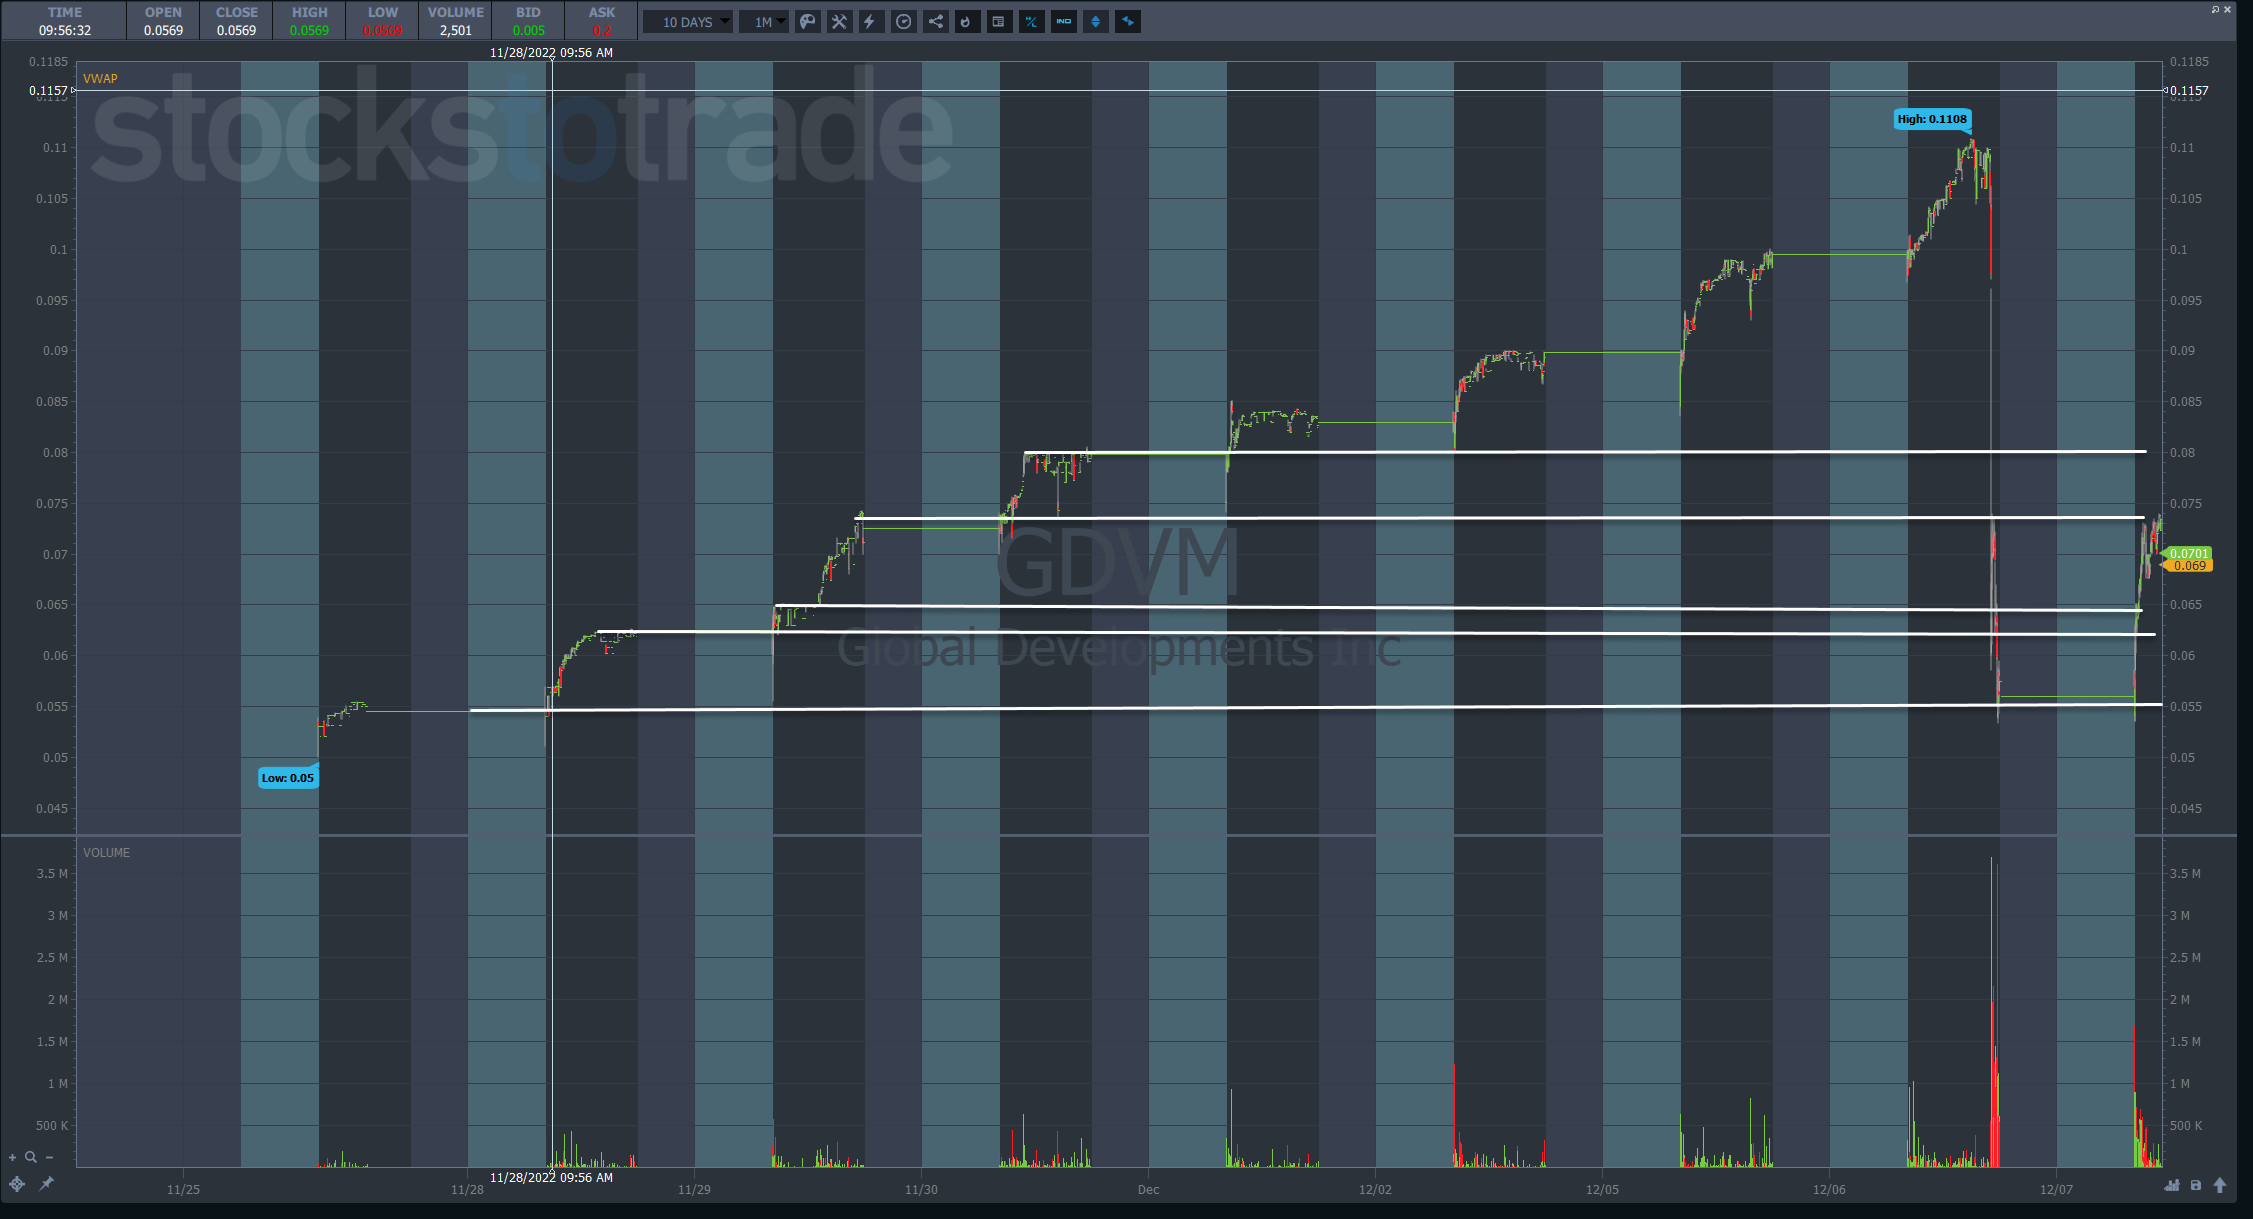
Taking a step back, I knew there were several areas where the stock might find support.

A lot of traders make technical analysis more difficult than it needs to be.

Most of the time, I just look for spots where price struggled to get through and spent time moving sideways.

With two spots near one another around $0.060-$0.065, that seems like a reasonable area for a bounce.

When I execute, I look both at the price action and level 2 data to time my entry.

But keep this in mind…as I stated in my trade notes, I would exit the trade by the close.

I fully expected a morning panic the following day.

And that’s where I saw opportunity.

Why Expect a Morning Panic?

the bottom line on support and resistance
© Millionaire Media, LLC

I know this is the question on your mind.

To start, I don’t know whether the stock is likely to open flat, higher, or lower.

That’s a tough call.

What I do know is there are bag holders that will look at their losses overnight, get mad, and sell at the open.

At the same time, promoters don’t want the stock to drop any further. So, they’ll be in their pumping buyers to scoop up shares.

In this case, I watched level 2 data and noticed the initial drop came from one big seller.

After that order cleared, there weren’t many sellers left.

Essentially, the selling pressure was exhausted.

That’s when I bought into the stock, not five minutes into the day, and rode it for some quick gains.

Trading is part science part art.

For me, it’s also about reading people’s behaviors through the tools at my disposal.

That’s why I encourage my students to study hard.

Some of this stuff isn’t intuitive and sometimes it is.

Once you learn enough information, the What, Why, Where, When, and How of a stock becomes clearer.

It’s a process and a skill. One that requires drive and hard work.

And ANYONE can get there.

—Tim


How much has this post helped you?


Leave a reply


Author card Timothy Sykes picture

Timothy Sykes

Tim Sykes is a penny stock trader and teacher who became a self-made millionaire by the age of 22 by trading $12,415 of bar mitzvah money. After becoming disenchanted with the hedge fund world, he established the Tim Sykes Trading Challenge to teach aspiring traders how to follow his trading strategies. He’s been featured in a variety of media outlets including CNN, Larry King, Steve Harvey, Forbes, Men’s Journal, and more. He’s also an active philanthropist and environmental activist, a co-founder of Karmagawa, and has donated millions of dollars to charity. Read More

Post image

Get my weekly watchlist, free

Sign up to jump start your trading education!

* Results are not typical and will vary from person to person. Making money trading stocks takes time, dedication, and hard work. There are inherent risks involved with investing in the stock market, including the loss of your investment. Past performance in the market is not indicative of future results. Any investment is at your own risk. See Terms of Service here

The available research on day trading suggests that most active traders lose money. Fees and overtrading are major contributors to these losses.

A 2000 study called “Trading is Hazardous to Your Wealth: The Common Stock Investment Performance of Individual Investors” evaluated 66,465 U.S. households that held stocks from 1991 to 1996. The households that traded most averaged an 11.4% annual return during a period where the overall market gained 17.9%. These lower returns were attributed to overconfidence.

A 2014 paper (revised 2019) titled “Learning Fast or Slow?” analyzed the complete transaction history of the Taiwan Stock Exchange between 1992 and 2006. It looked at the ongoing performance of day traders in this sample, and found that 97% of day traders can expect to lose money from trading, and more than 90% of all day trading volume can be traced to investors who predictably lose money. Additionally, it tied the behavior of gamblers and drivers who get more speeding tickets to overtrading, and cited studies showing that legalized gambling has an inverse effect on trading volume.

A 2019 research study (revised 2020) called “Day Trading for a Living?” observed 19,646 Brazilian futures contract traders who started day trading from 2013 to 2015, and recorded two years of their trading activity. The study authors found that 97% of traders with more than 300 days actively trading lost money, and only 1.1% earned more than the Brazilian minimum wage ($16 USD per day). They hypothesized that the greater returns shown in previous studies did not differentiate between frequent day traders and those who traded rarely, and that more frequent trading activity decreases the chance of profitability.

These studies show the wide variance of the available data on day trading profitability. One thing that seems clear from the research is that most day traders lose money .

Millionaire Media 66 W Flagler St. Ste. 900 Miami, FL 33130 United States (888) 878-3621 This is for information purposes only as Millionaire Media LLC nor Timothy Sykes is registered as a securities broker-dealer or an investment adviser. No information herein is intended as securities brokerage, investment, tax, accounting or legal advice, as an offer or solicitation of an offer to sell or buy, or as an endorsement, recommendation or sponsorship of any company, security or fund. Millionaire Media LLC and Timothy Sykes cannot and does not assess, verify or guarantee the adequacy, accuracy or completeness of any information, the suitability or profitability of any particular investment, or the potential value of any investment or informational source. The reader bears responsibility for his/her own investment research and decisions, should seek the advice of a qualified securities professional before making any investment, and investigate and fully understand any and all risks before investing. Millionaire Media LLC and Timothy Sykes in no way warrants the solvency, financial condition, or investment advisability of any of the securities mentioned in communications or websites. In addition, Millionaire Media LLC and Timothy Sykes accepts no liability whatsoever for any direct or consequential loss arising from any use of this information. This information is not intended to be used as the sole basis of any investment decision, nor should it be construed as advice designed to meet the investment needs of any particular investor. Past performance is not necessarily indicative of future returns.

Citations for Disclaimer

Barber, Brad M. and Odean, Terrance, Trading is Hazardous to Your Wealth: The Common Stock Investment Performance of Individual Investors. Available at SSRN: “Day Trading for a Living?”

Barber, Brad M. and Lee, Yi-Tsung and Liu, Yu-Jane and Odean, Terrance and Zhang, Ke, Learning Fast or Slow? (May 28, 2019). Forthcoming: Review of Asset Pricing Studies, Available at SSRN: “https://ssrn.com/abstract=2535636”

Chague, Fernando and De-Losso, Rodrigo and Giovannetti, Bruno, Day Trading for a Living? (June 11, 2020). Available at SSRN: “https://ssrn.com/abstract=3423101”