timothy sykes logo

Patterns To Watch

How THIS Blueprint Nailed $MMTLP

Timothy SykesAvatar
Written by Timothy Sykes
Updated 12/13/2022 5 min read

Every year, something unusual happens.

While folks start to check out for the holidays, OTC and penny stocks start to heat up.

It’s a phenomenon I like to call the Winter Glitch.

Once dormant stocks start multi-day runs that create EPIC trade opportunities.

But here’s the thing…

Even the best stock runs come to an end.

Unfortunately, traders get caught up in the moment and forget about gravity.

Time and again folks buy at the top only to watch the price plunge the very next day, wiping out any gains they made on the way up.

I ALWAYS treat penny stocks like hot lava.

After getting burned myself numerous times, I developed my 7-Step Penny Stock Framework.

It’s remarkable how ACCURATE it is nearly two decades later.

In just the last few months, I used this framework to win 8 of 11 trades in Meta Materials (OTC: MMTLP) for a net profit of $4,144 since early October.

Yet, I always remained wary of the crash I knew was coming.

Sure enough, shares crashed, and FINRA halted the stock, angering the Twittersphere.

I was accused of short-selling, which I haven’t done in years.

As I explained in this YouTube video, MMTLP shouldn’t have surprised anyone.

Every (almost) penny that goes Supernova will crash.

The 7-Step Penny Stock Framework can tell you what to expect.

However, choosing the correct setup makes the whole thing work.

Thankfully, you don’t have to memorize a huge list.

Just a few ideas are all you need to know.

Let me walk you through a few examples, including MMTLP, demonstrating this incredible framework in action.

The Correct Mindset

© Millionaire Media, LLC

Carvana (NASDAQ: CVNA) was a Wall Street darling through the pandemic and beyond.

At one point, the stock traded at $376.83.

Today, it’s on the cusp of bankruptcy.

99% of the time, investing fads and trends fail, whether it’s electric vehicles, cryptocurrencies, dotcoms…you name it.

Heck, in 1908 there were 253 auto manufacturers in the U.S.

By 1929 that dropped to 44.

At the beginning of 1940, 90% of all U.S. car sales came from three companies.

Bubbles aren’t anything new. They’ve been around for hundreds of years.

I intentionally look for stocks that I form a bubble and pop, which I call Supernova.

These penny stocks go parabolic, jumping tens, hundreds, and sometimes thousands of percentage points in days.

I expect everyone to fail.

Most investors hold shares in a company never knowing what malfeasance lurks around the corner.

Instead, I find companies with promoters pushing the stock, knowing shares are manipulated, and trade accordingly, because they all follow my 7-Step Penny Stock Framework.

Let me show you what I mean.

The Framework in Action

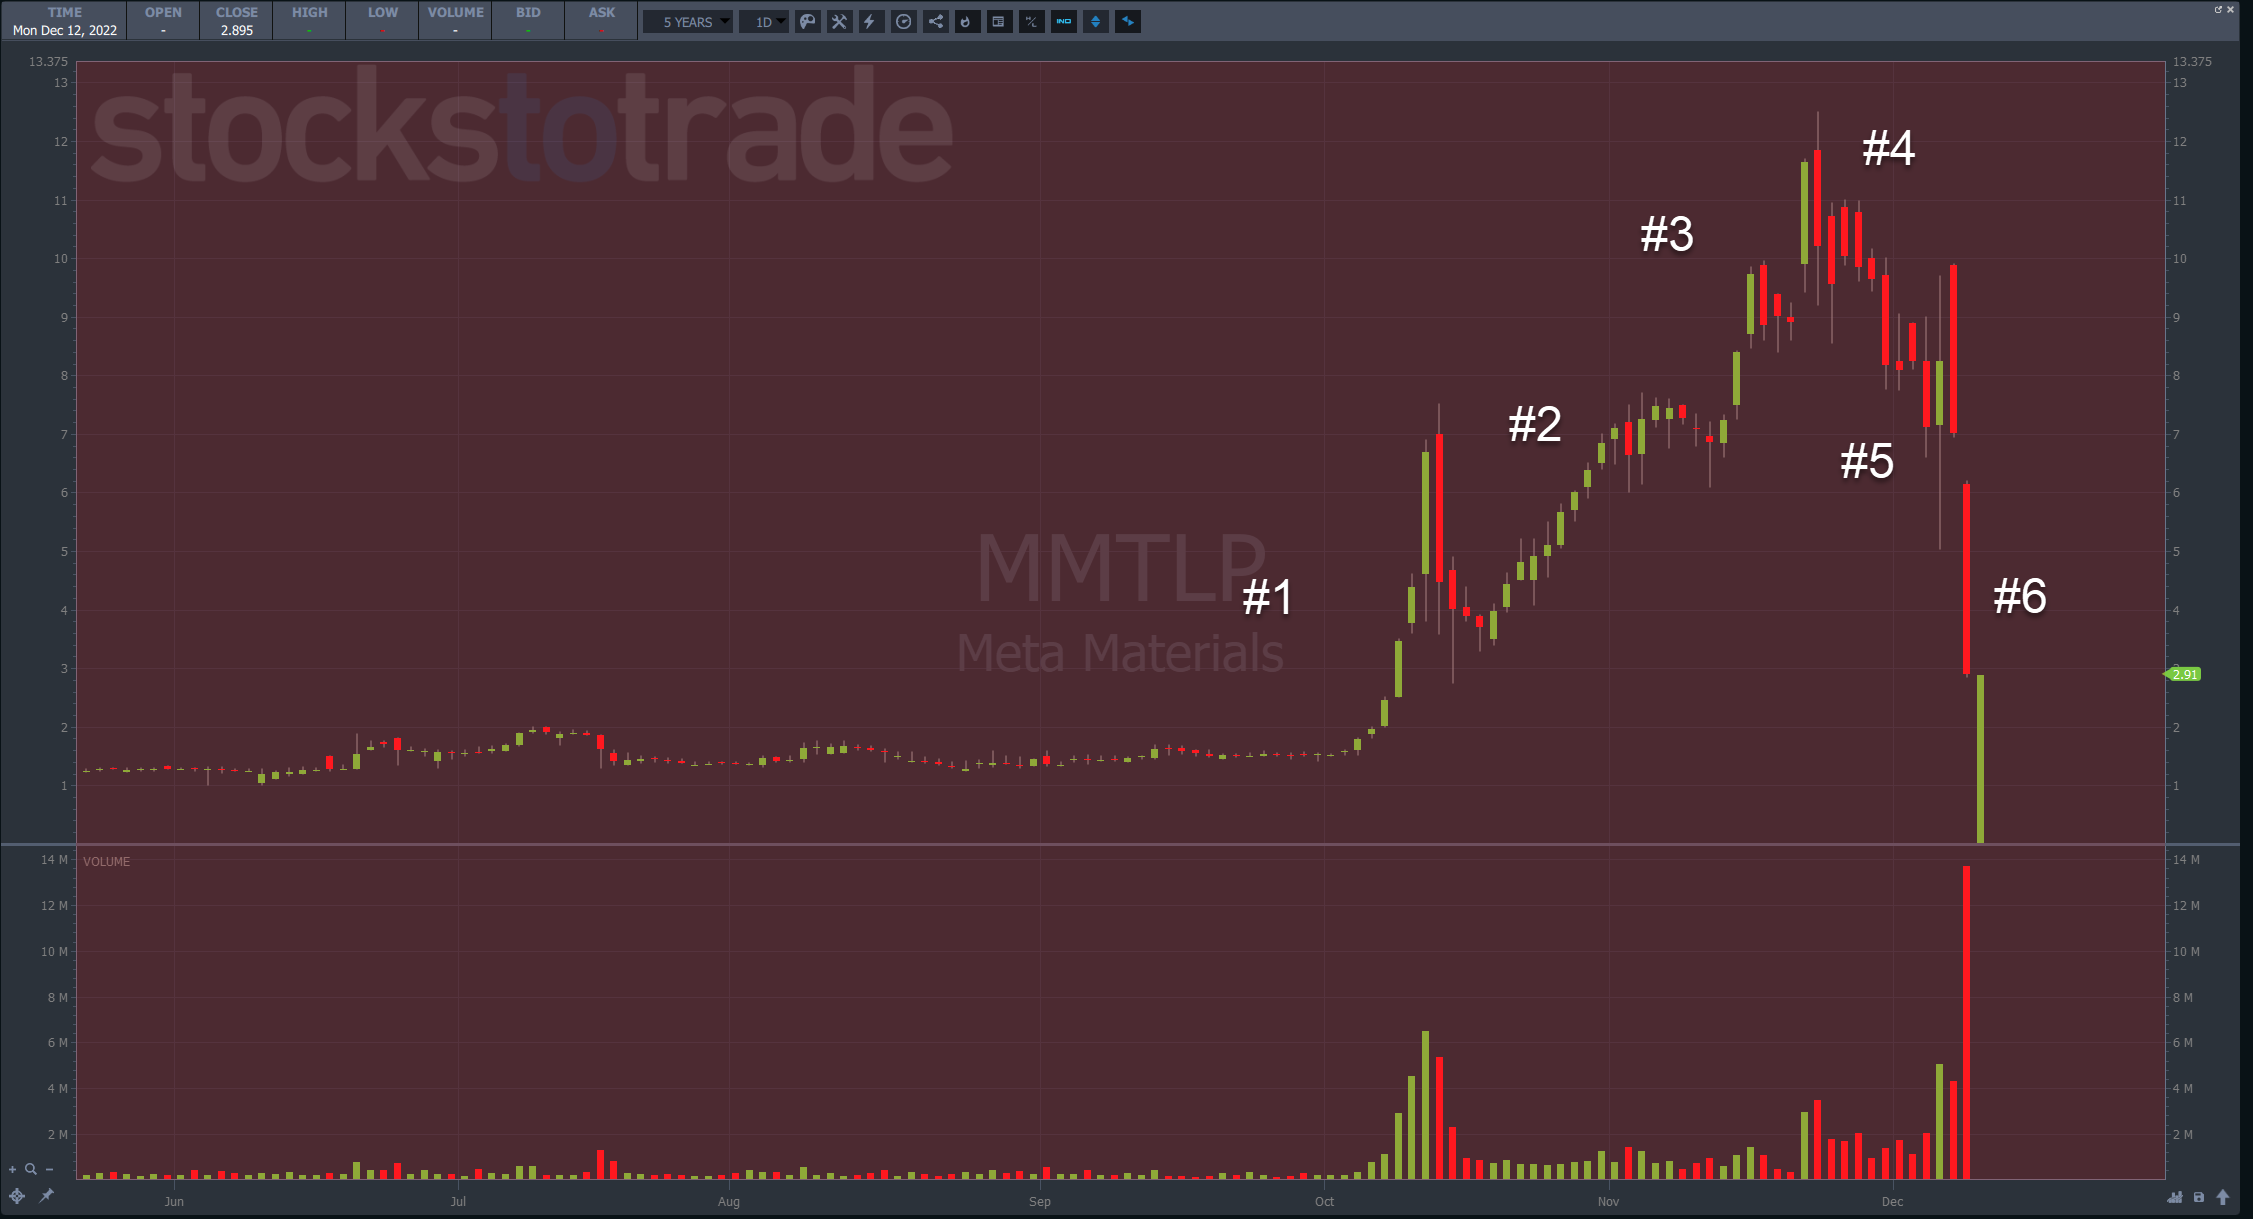
After you review the  7-Step Penny Stock Framework, take a look at the chart above.

It’s incredible how accurately MMTLP followed the framework.

During phases #2-#3, I traded breakouts as the stock made new highs.

But I was ALWAYS cautious, never trying to extend my gains more than appropriate.

Most winners were 5%-10% gains.

And I was always quick to cut losses.

The last trade I took was on December 6, that last long green candle near #5.

That’s the spot where I like to look for morning panic dip buy opportunities.

As long as I manage my risk and toss trades at any signs of failure, I ensure I don’t get caught in a major downdraft.

Now, sometimes stocks don’t follow the framework cleanly and provide tradeable setups.

Eargo Inc. (NASDAQ: EAR) is an example from late summer.

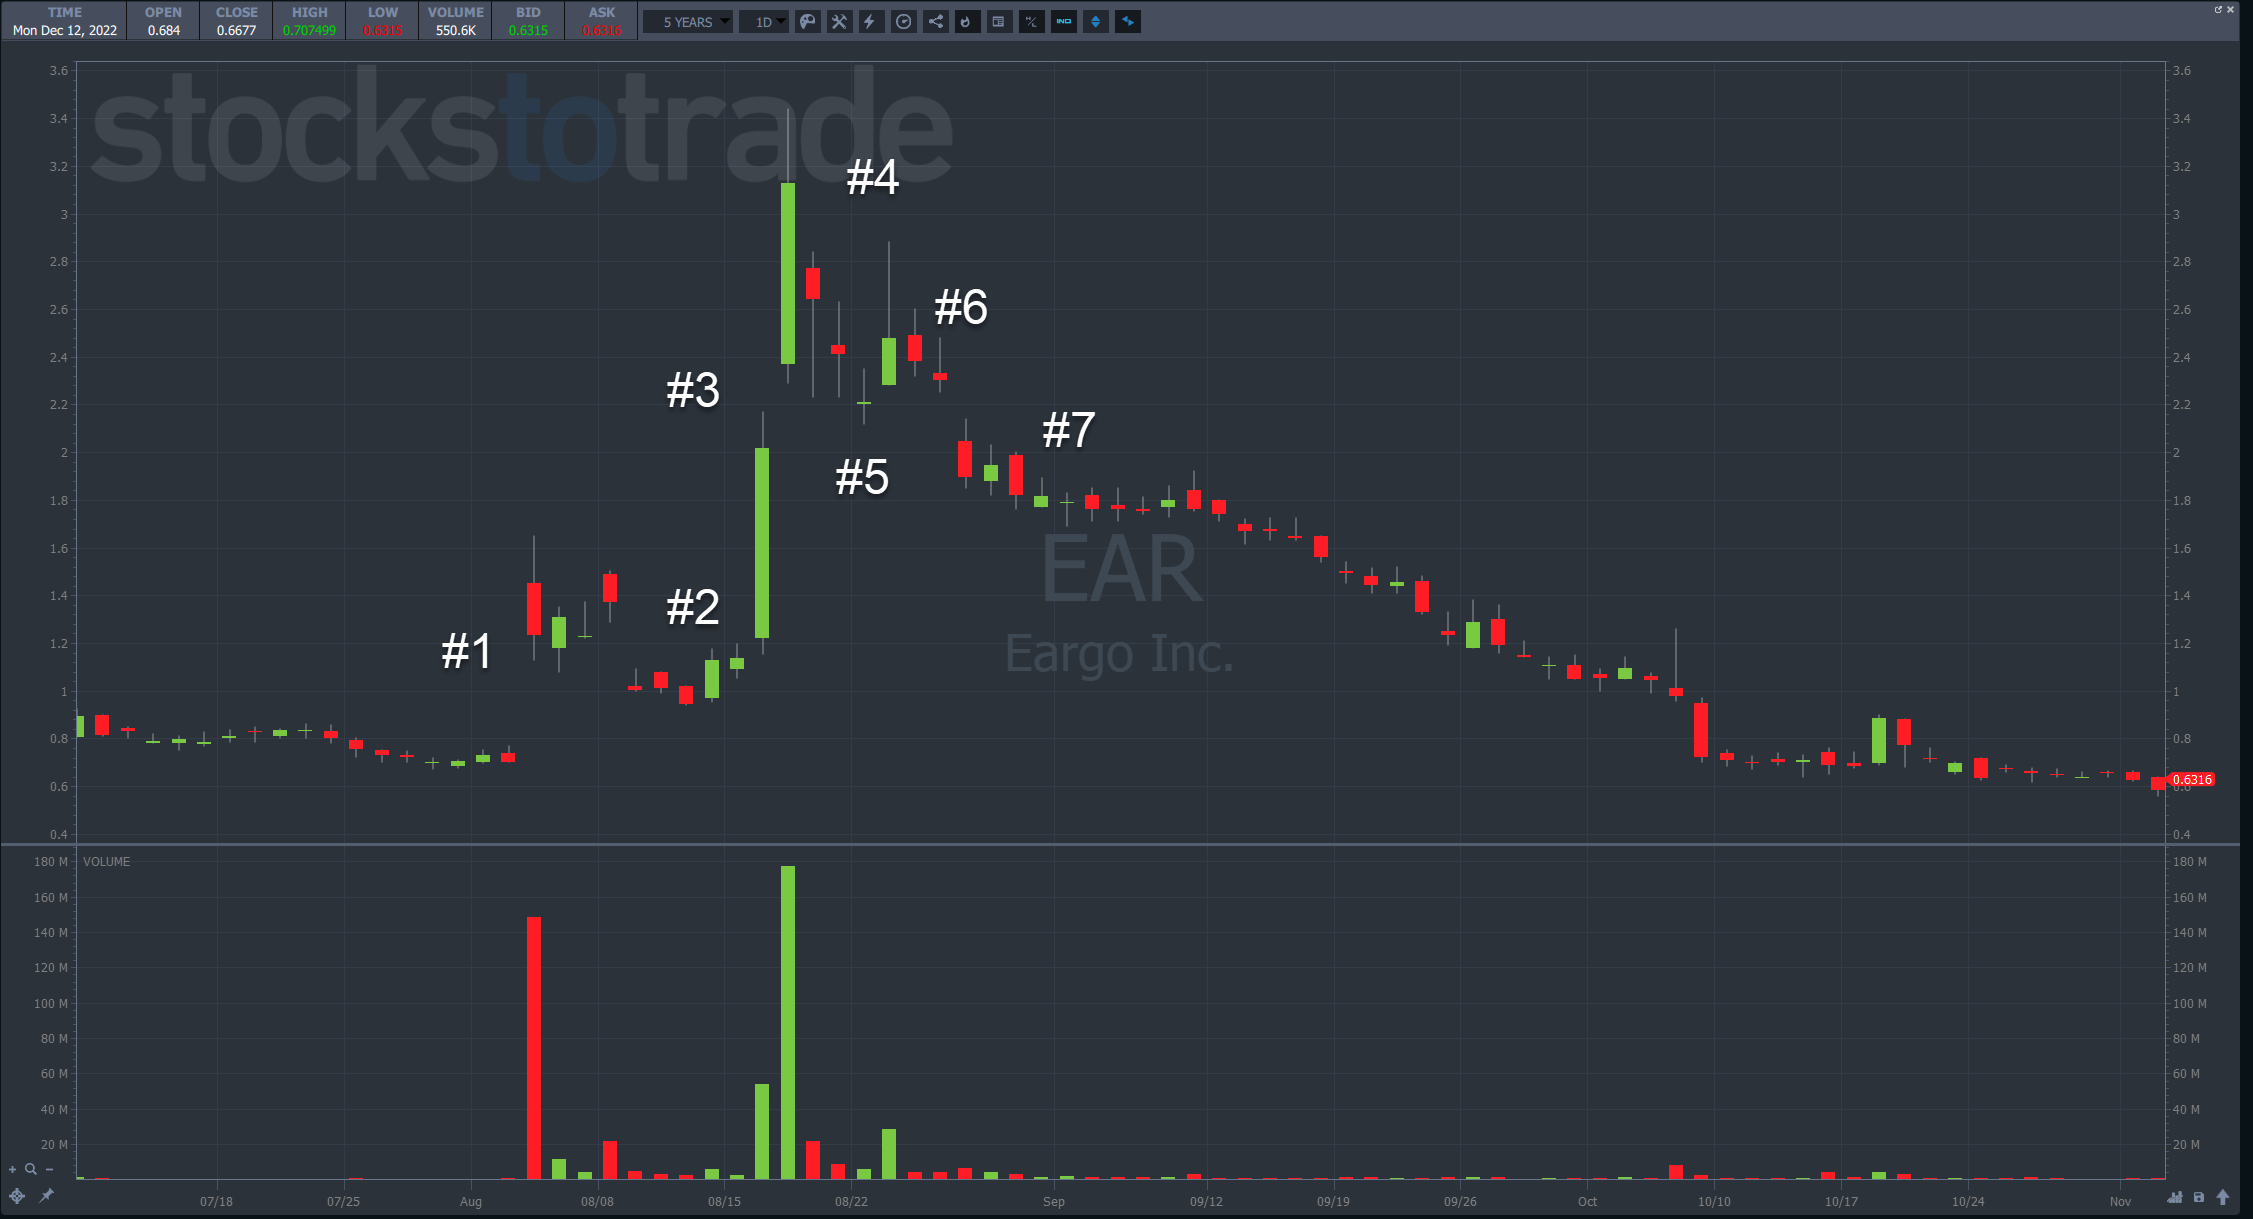
When price began to go Supernova, it did so in just a couple of days. That didn’t leave much time to play breakouts.

On the other side, the dip buy areas weren’t deep enough to interest me.

The framework still applied. However, the stock didn’t offer up any trades.

Here’s another example using Cosmos Holdings Inc. (NASDAQ: COSM).

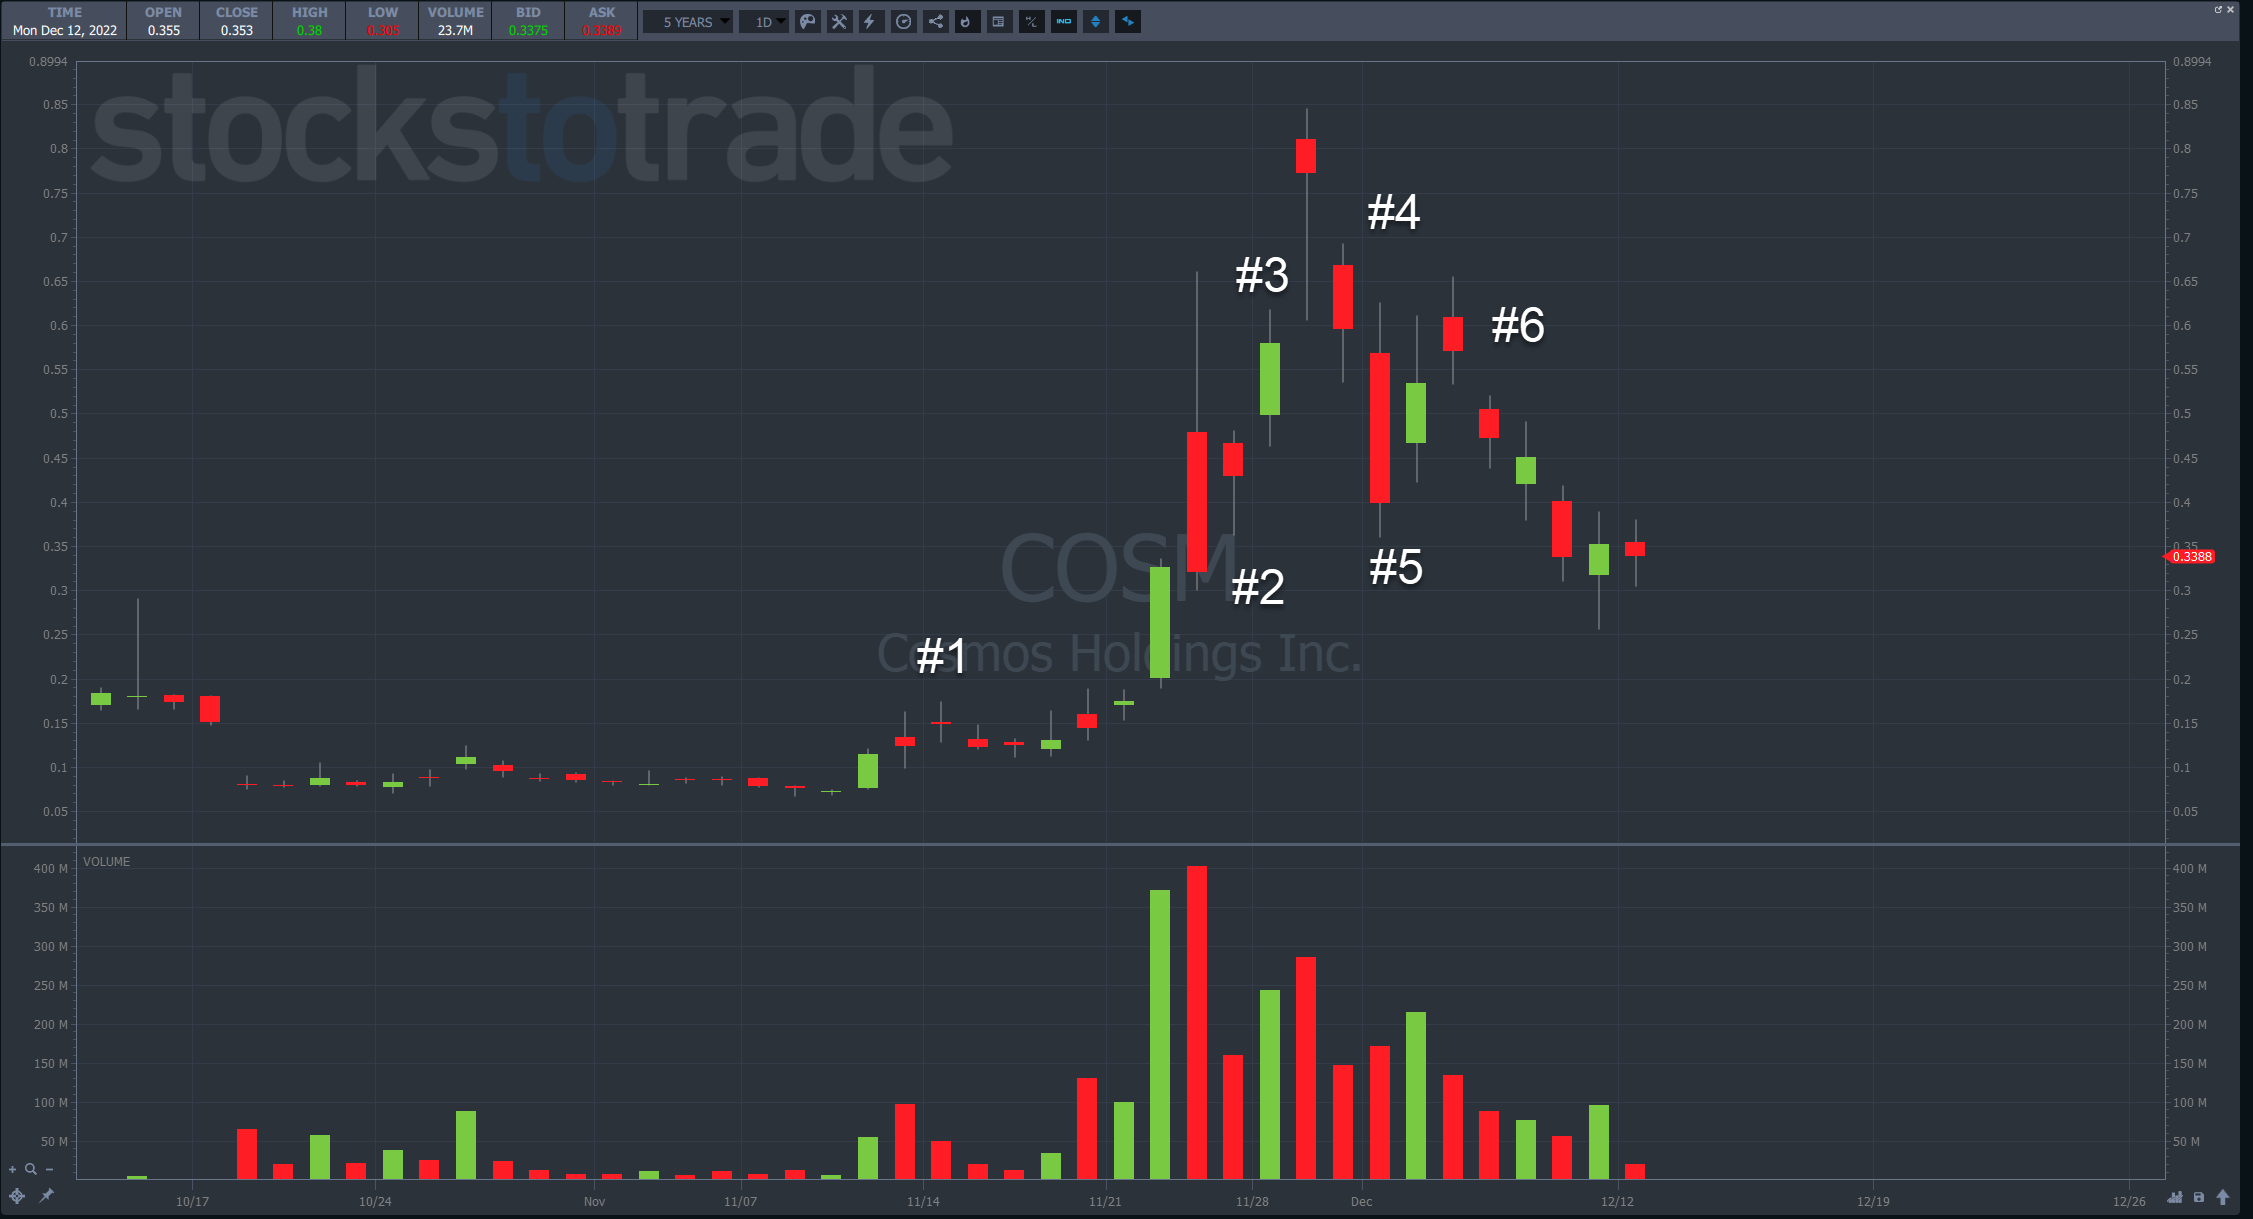
Here, COSM didn’t provide much in the way of breakout trades on the front side.

However, when shares plunged, they definitely came down enough to create possible dip buy opportunities.

The point is that the framework tells you what to expect.

From there, you select the setup that matches the phase of the framework.

After that, the stock will either provide you an opportunity or it won’t.

However, when you study these patterns and know what to look for, you find more of these. And the more you find, the greater the odds of a tradeable opportunity.

—Tim


How much has this post helped you?


Leave a reply


Author card Timothy Sykes picture

Timothy Sykes

Tim Sykes is a penny stock trader and teacher who became a self-made millionaire by the age of 22 by trading $12,415 of bar mitzvah money. After becoming disenchanted with the hedge fund world, he established the Tim Sykes Trading Challenge to teach aspiring traders how to follow his trading strategies. He’s been featured in a variety of media outlets including CNN, Larry King, Steve Harvey, Forbes, Men’s Journal, and more. He’s also an active philanthropist and environmental activist, a co-founder of Karmagawa, and has donated millions of dollars to charity. Read More

Post image

Get my weekly watchlist, free

Sign up to jump start your trading education!

* Results are not typical and will vary from person to person. Making money trading stocks takes time, dedication, and hard work. There are inherent risks involved with investing in the stock market, including the loss of your investment. Past performance in the market is not indicative of future results. Any investment is at your own risk. See Terms of Service here

The available research on day trading suggests that most active traders lose money. Fees and overtrading are major contributors to these losses.

A 2000 study called “Trading is Hazardous to Your Wealth: The Common Stock Investment Performance of Individual Investors” evaluated 66,465 U.S. households that held stocks from 1991 to 1996. The households that traded most averaged an 11.4% annual return during a period where the overall market gained 17.9%. These lower returns were attributed to overconfidence.

A 2014 paper (revised 2019) titled “Learning Fast or Slow?” analyzed the complete transaction history of the Taiwan Stock Exchange between 1992 and 2006. It looked at the ongoing performance of day traders in this sample, and found that 97% of day traders can expect to lose money from trading, and more than 90% of all day trading volume can be traced to investors who predictably lose money. Additionally, it tied the behavior of gamblers and drivers who get more speeding tickets to overtrading, and cited studies showing that legalized gambling has an inverse effect on trading volume.

A 2019 research study (revised 2020) called “Day Trading for a Living?” observed 19,646 Brazilian futures contract traders who started day trading from 2013 to 2015, and recorded two years of their trading activity. The study authors found that 97% of traders with more than 300 days actively trading lost money, and only 1.1% earned more than the Brazilian minimum wage ($16 USD per day). They hypothesized that the greater returns shown in previous studies did not differentiate between frequent day traders and those who traded rarely, and that more frequent trading activity decreases the chance of profitability.

These studies show the wide variance of the available data on day trading profitability. One thing that seems clear from the research is that most day traders lose money .

Millionaire Media 66 W Flagler St. Ste. 900 Miami, FL 33130 United States (888) 878-3621 This is for information purposes only as Millionaire Media LLC nor Timothy Sykes is registered as a securities broker-dealer or an investment adviser. No information herein is intended as securities brokerage, investment, tax, accounting or legal advice, as an offer or solicitation of an offer to sell or buy, or as an endorsement, recommendation or sponsorship of any company, security or fund. Millionaire Media LLC and Timothy Sykes cannot and does not assess, verify or guarantee the adequacy, accuracy or completeness of any information, the suitability or profitability of any particular investment, or the potential value of any investment or informational source. The reader bears responsibility for his/her own investment research and decisions, should seek the advice of a qualified securities professional before making any investment, and investigate and fully understand any and all risks before investing. Millionaire Media LLC and Timothy Sykes in no way warrants the solvency, financial condition, or investment advisability of any of the securities mentioned in communications or websites. In addition, Millionaire Media LLC and Timothy Sykes accepts no liability whatsoever for any direct or consequential loss arising from any use of this information. This information is not intended to be used as the sole basis of any investment decision, nor should it be construed as advice designed to meet the investment needs of any particular investor. Past performance is not necessarily indicative of future returns.

Citations for Disclaimer

Barber, Brad M. and Odean, Terrance, Trading is Hazardous to Your Wealth: The Common Stock Investment Performance of Individual Investors. Available at SSRN: “Day Trading for a Living?”

Barber, Brad M. and Lee, Yi-Tsung and Liu, Yu-Jane and Odean, Terrance and Zhang, Ke, Learning Fast or Slow? (May 28, 2019). Forthcoming: Review of Asset Pricing Studies, Available at SSRN: “https://ssrn.com/abstract=2535636”

Chague, Fernando and De-Losso, Rodrigo and Giovannetti, Bruno, Day Trading for a Living? (June 11, 2020). Available at SSRN: “https://ssrn.com/abstract=3423101”