
Money is attracted to speed.
Nothing is more true in trading.
A second faster can mean the difference between capturing massive profits or missing out entirely.
Just look at all the action we saw in AI-related stocks last week.
Ticker symbol CXAI went from $1.21 to a high of $69.47…
GFAI went from $8.82 to a high of $39.20…
And SAI went from $1.17 to $7.40…
I hope when you see and hear about moves like this:
- You get excited about the potential the market offers
- You’re curious into why these stocks moved so much.
The most obvious relationship between these three stocks is that the last two letters of their ticker symbol was AI.
But that’s just scratching the surface.
After all, one of the first stocks to kick off the AI rally was BZFD…but that stock hasn’t done much since its January highs…In fact, it has sold off considerably.
And the “sector leader” AI, barely moved last week.
There are two main reasons why some AI stocks are popping off while others are sitting idle.
Here they are…
Market Structure

I think it’s a good practice to look at a company’s stock structure before trading it.
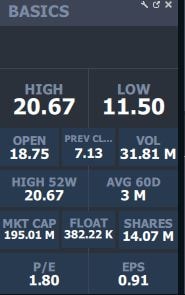
For example, check out these details in CXAI:
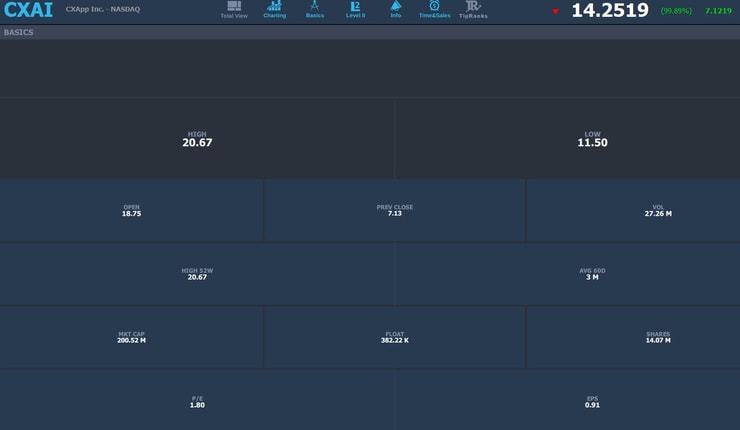
Source: StocksToTrade
So when I’m looking at a company’s stock structure I’m paying attention to the market cap, float, and average trading volume.
Based on Friday’s action CXAI had a market cap of about $200.5 million. This tells me that the stock is a micro/small-cap company. Ideally, you want to stick to small caps because they have the most volatility and opportunity.
Second, which is the most important is the float. This tells me how many floating shares there are out there.
According to StocksToTrade data, CXAI has a float of under 500K shares.
That’s an extremely low float. Generally, stocks with floats of under 10 million are considered low floats.
Trading is all about supply vs. demand. If there is a low quantity of shares available then it’s a lot easier to push prices.
Third, I want to see the average stock volume. Over the last 60 days CXAI has traded an average of 3 million shares. That’s 6x the float!
However, last Thursday it traded 163 million shares…
Another thing worth looking at is short-interest. This tells us what percentage of the float is short the stock. Stocks with high short-interest (above 10%) have a better chance of going Supernova…
But just because a stock doesn’t have a high short-interest doesn’t mean it’s not worth trading. Short-interest data is not released in real-time. So a lot of stuff can change, especially when these stocks take off…it sucks in new shorts.
Stubborn Shorts

None of these Supernovas would have occurred had it not been for stubborn shorts.
Look I get it…
I used to be a short-seller.
Most of these companies are trying to capitalize on the AI trend…their businesses are trash…yet their stock prices are spiking because the last two letters in their symbol have AI.
It’s pretty dumb…and that’s why I always tell my students to expect the worst from these companies.
Chances are these stocks will go back down…
The only problem is we don’t know when.
CXAI probably looked like an easy short when it climbed from $1.17 to $6…
But it kept sucking in the shorts…
And because the float was so low…the stock more or less got hijacked.
Source: StocksToTrade
It went to the teens, 20s, 30s, 40s, 50s, and 60s.
I’m sure the shorts got destroyed.
The combination of a low float and stubborn shorts caused CXAI to Supernova.
This game usually ends when the company announces a stock offering to raise capital.
Or if it goes absolutely crazy like HKD…then the exchange or someone will halt the stock and investigate it. Last year HKD went from $13 to $2555 in a few short weeks…
Making it the craziest Supernova of all-time.
More Breaking News
- FCEL Rallies As Traders Target Momentum In FuelCell
- IBM Stock Rockets As U.S. Backs New Quantum Chip Foundry
- Trade Desk Stock Slides As Wall Street Resets Price Targets
- KEEL Stock Pops As Chardan Backs AI Power Shift
It now trades under $8 a share.
Bottom Line

Many of these companies are trying to pump off the AI trend…but some have a better chance of going Supernova than others.
I believe it has to do with the company’s stock structure.
I know a lot of traders like to highlight short-interest as the holy-grail indicator for squeezes, but who had CXAI, GFAI, MRAI, and GFAI on their radar 3 weeks ago?
I think it makes more sense to look at how many shares are floating and how much trading volume is going through these symbols.
You can find a lot of good sympathy plays if you take this into account.
If you’d like to learn more about how I trade Supernovas then check this out.
P.S. It’s raining Supernovas…find out how I play them here.

Leave a reply