God bless these new trading challenge students and their guest posts…this is a good one on debt basics:
Debt is one of the few things that can turn a profitable company into a bust. Heavily debt laden companies can immediately see a falling share price if earnings shrink, or if the company cannot turn to profit within a few quarters. When the debt incurred fails to return more than the cost and interest expense of the debt it becomes a serious burden on the company. Earnings periods can be an ideal time to play on negative prospects for a company in the long-term. You can open and close a trade in a matter of days or weeks.
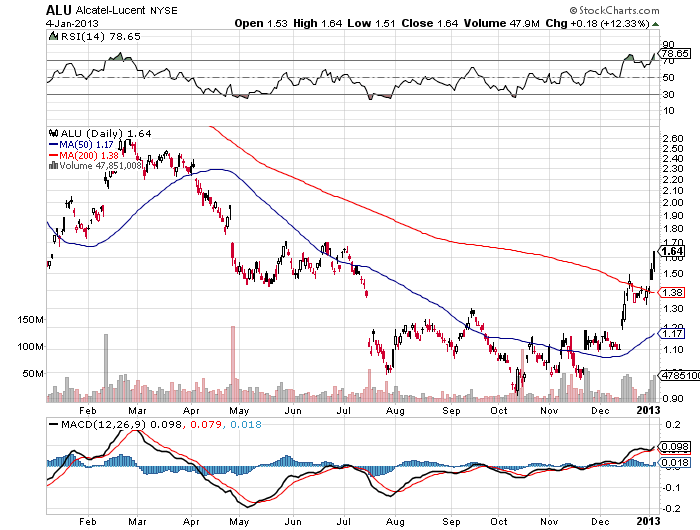
You can see on the Alcatel-Lucent chart that a big gap down occurred in July. The entire downward trend, and particularly the steep falls last year were due to posting losses as well as debt maturities that were years away hanging over them. Shorting the stock would have been extremely profitable back then. Playing the credit agreement news would have been a quick long trade that made money. Companies that are undergoing strife and uncertainty present opportunities on both sides of the market.
Debt is the focus here, but when screening for stocks make sure to use a market cap you are comfortable with. I would avoid using a limitation such as negative earnings, because you are looking for companies walking a fine line that might have their luck change. Once debt-laden companies are identified they should be judged individually, and if you keep up with the news you will probably recognize ones that are worth watching. These normally have issues like flat revenue, deteriorating margins, etc. but not necessarily losses.
1. Debt-to-Equity Ratio
The debt-to-equity ratio measures if a company has more debt than equity. For some companies that is normal, such as manufacturers. For technology companies it can tend to be lower unless the company has been on an acquisition frenzy. The higher the ratio the more debt the company has relative to its worth, and anything over 1 means that it owes more than it’s worth. Think about underwater mortgages, because it is a similar concept. The lower the ratio the less debt there is compared to the size of the company.
You do not want to cast the net too narrowly when looking at the ratio. When using a screener you can try 0.75 and above, though if you really want to look for distressed companies you can increase this to the 0.90 range. Just remember to check its peers to figure out what is a good ratio for the industry.
2. Long-Term Debt
This is not really a metric, and it is somewhat incorporated into the debt-to-equity ratio. However, long-term debt is so important enough that it warrants close attention. It is a good idea to look at long-term debt to see if there is a lot of it on the horizon. The debt-to-equity ratio incorporates all kinds of debt, but long-term debt is the kind that becomes problematic since it is due so much later. The situation of the company when it incurred those debts might be drastically different from the present, or the future period when that debt is due.
It is also useful to look at long-term debt compared to current cash. A company might be debt heavy but if most of its assets are cash, then long-term debt is less of an issue since it can push back the day of reckoning.
A company like LDK might incur a huge debt to expand, but that is rare. LDK was another fantastic short that could have been seen coming, because the company had insane amounts of debt and was in the weakening solar market. LDK might be getting some government help to deal with their debt problems, but it remains to be seen if this will have a positive effect on the stock. Going with call options might be safer than buying the stock.
Most companies incur debts over time that accumulate to become scary numbers on balance sheets. A large cash position can push back the pain, though if the company is posting big losses it might not be enough. There is no proper screener amount for this number. You would look at this balance sheet item individually once you have narrowed down a list.
3. Current Ratio
The current ratio incorporates both cash and short-term debt. It is supposed to be a quick ratio that determines if a company can meet its current liabilities with its current assets. Any number over 1 means that the company does not have a liquidity problem. This metric is not about solvency. A company can have many assets, but if it is not very liquid it might have trouble paying some obligations. It is like if you only had solid gold and had an electric bill due in the next two days. Your gold is valuable, but could you get top dollar in two days?
When looking in a screener you probably want to go with companies that have a ratio less than 1.25. The ratios can get very high, for example ATVI has a ratio around 3 because of its solid cash position. The current ratio can be a tricky one because even extremely healthy companies can have one below 1, because cash might come in right when its needed for payments, but is not sitting the balance sheet. However, if you are also looking for high debt companies, then it should narrow the field.
Additional Details
If the screeners return too many results to sort through you can tweak the parameters a bit. The final filter you can add if necessary is to use one of the many revenue growth measures and choose less than 3%. This will show companies that are having a hard time growing top line revenue. I would not focus on earnings, because companies can save or even grow earnings by boosting margins through cutbacks, but this cannot continue for long. Look at revenue growth for a few quarters to establish a trend, not just the most recent.

Leave a reply