

Skydance Corporation Class B stocks have been trading down by -4.41 percent amid concerns over weakening franchise performance and revenue growth.
What Traders Need To Know
- Shares sold off 8.3% after Skydance Corporation Class B completed its Warner Bros. Discovery asset acquisition and announced related debt retirement and note exchanges.
- The stock then dropped about 6.7%, ranking as the worst performer in the S&P 500 after further detail on restructuring Warner Bros. Discovery notes and retiring legacy debt.
- A later, sharper move saw shares sink about 25% on heavy volume after a court blocked Donald Trump’s attempted ban on CNN’s White House access, underscoring Skydance’s political headline risk.
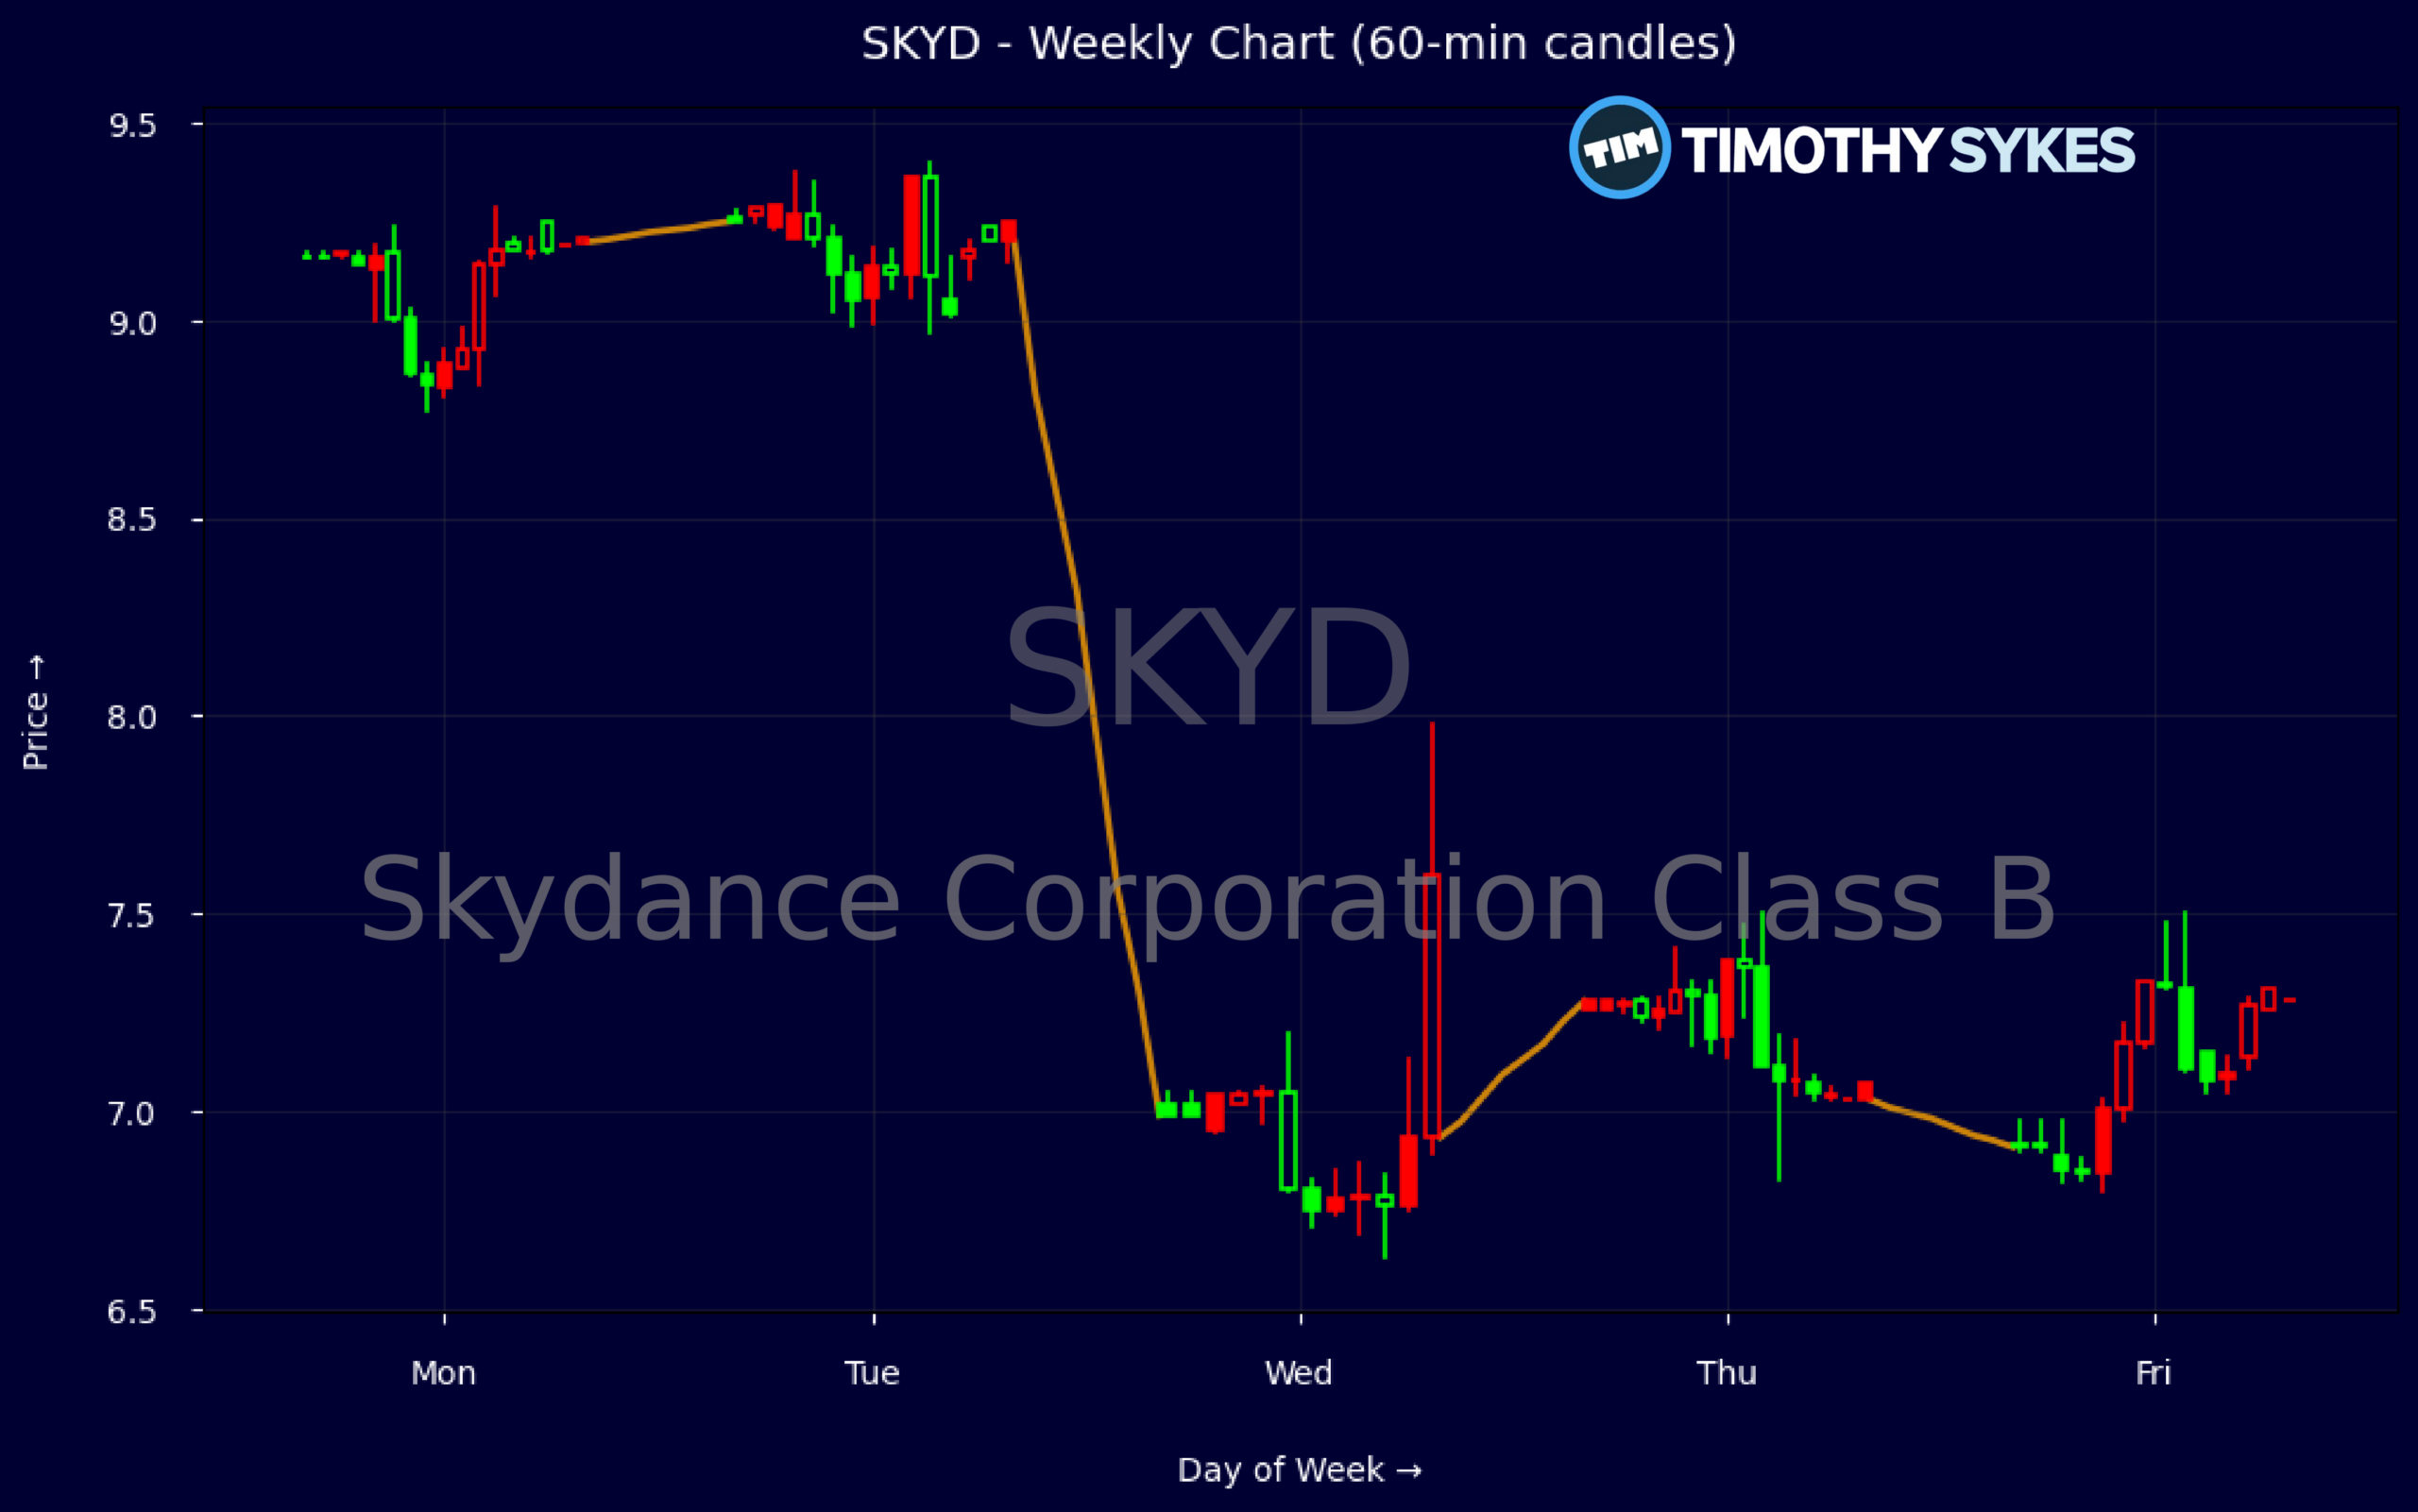
Weekly Update Oct 12 – Oct 16, 2026: On Friday, October 16, 2026 Skydance Corporation Class B stock [NYSE: SKYD] is trending down by -4.41%! Discover the key drivers behind this movement as well as our expert analysis in the detailed breakdown below.
Media & Telecommunications industry expert:
Analyst sentiment – neutral
Skydance (SKYD) now screens as a highly operationally efficient but strategically overlevered, low-growth media conglomerate. EBITDA margin above 60% and 55% gross margin underscore the value of the Warner Bros. Discovery assets, yet consolidated EBIT margin is just 4.9% and net margins remain slightly negative, driving ROE of roughly -3% and ROA below -1%. Revenue is stagnant to slightly declining over 3–5 years, while price-to-sales of 0.4x and price-to-book of 0.9x show the equity trades at a clear “show-me” discount. Balance sheet leverage is substantial (total debt/equity 1.4x; long-term debt ~$14.4bn; leverage ratio 3.8x), but interest coverage of 13x and solid Q3 operating cash flow of $268m and FCF of $222m indicate the capital structure is serviceable, if not comfortable, provided management executes on integration and synergies.
Technically, SKYD’s weekly tape is decisively bearish with accelerating downside momentum. The stock broke from $9.26 to $7.02 in one session, followed by a weak bounce to $7.26 and renewed selling to $6.92, confirming lower highs and lower lows on heavy volume around the mid-$7s. Intraday 5‑minute candles show persistent supply on any upticks, suggesting systematic selling rather than retail noise. Dominant trend is down; rallies into the $7.20–$7.30 zone should be sold with a tight stop above $7.50, targeting a retest of $6.50 near-term, which is the first meaningful actionable support area traders should monitor.
Fundamentally, news flow is negative in the short term but constructive strategically. The debt restructuring and retirement of most legacy Warner Bros. notes is balance-sheet positive, yet the stock fell 8% on announcement and a further ~25% after the politically charged CNN-related court ruling, making SKYD the worst S&P 500 performer on those days. Versus Media & Telecom peers, SKYD trades at a steeper discount than traditional media benchmarks, reflecting governance and political-risk overhang in addition to leverage concerns. However, with high cash generation, resolved legacy capital structure, and a still-powerful IP portfolio, risk-reward skews favorably below $7. I expect 12–18 month mean reversion toward $9–$10, with $6.50 as key support and $8.50–$9.00 the first resistance band institutional investors should use for partial profit-taking.
More Breaking News
Quick Financial Overview
Skydance Corporation Class B (SKYD) has been hit by a fast, deep re-pricing. The weekly chart shows a slide from above $9 early in the period to around $6.92 by the latest close, a drop of roughly 25% in just a few trading days. That steep decline lines up with the 8.3% and 6.7% drops around the Warner Bros. Discovery acquisition news, followed by the 25% plunge tied to the CNN court order.
On the intraday tape, SKYD printed a high near $7.29 before fading steadily into the close around $6.92. The pattern is classic intraday distribution: early strength, then lower highs and a weak close, with price pinned near the day’s lower range. For short-term traders, that kind of close usually signals lingering supply and limited dip-buying conviction into the bell.
Fundamentals show a mixed picture. Revenue runs near $28.89B, but profit margins are thin to negative, with pretax and net margins both slightly below zero. Despite that, EBITDA margin above 60% and a 55% gross margin suggest meaningful cash generation, backed by quarterly free cash flow of about $222M and operating cash flow of $268M. Leverage is real, with total debt-to-equity around 1.38 and long-term debt near $14.39B, but interest coverage at 13.3x offers some cushion.
Conclusion
This is stock news, not investment advice. Timothy Sykes News delivers real-time stock market news focused on key catalysts driving short-term price movements. Our content is tailored for active traders and investors seeking to capitalize on rapid price fluctuations, particularly in volatile sectors like penny stocks. Readers come to us for detailed coverage on earnings reports, mergers, FDA approvals, new contracts, and unusual trading volumes that can trigger significant short-term price action. Some users utilize our news to explain sudden stock movements, while others rely on it for diligent research into potential investment opportunities.
Dive deeper into the world of trading with Timothy Sykes, renowned for his expertise in penny stocks. Explore his top picks and discover the strategies that have propelled him to success with these articles:
- Penny Stocks Trading Guide
- Best Penny Stocks Under $1 to Buy Today
- Top 8 Penny Stocks to Watch on Robinhood
Once you’ve got some stocks on watch, elevate your trading game with StocksToTrade the ultimate platform for traders. With specialized tools for swing and day trading, StocksToTrade will guide you through the market’s twists and turns.
Dig into StocksToTrade’s watchlists here:




Leave a reply