

Robin Energy Ltd.’s stocks have been trading up by 148.39 percent amid heightened optimism from its latest growth-focused developments.
Key Takeaways
- RBNE has collapsed from above $2.30 to under $0.40 within weeks, flashing extreme volatility that active traders crave but longer-term holders fear.
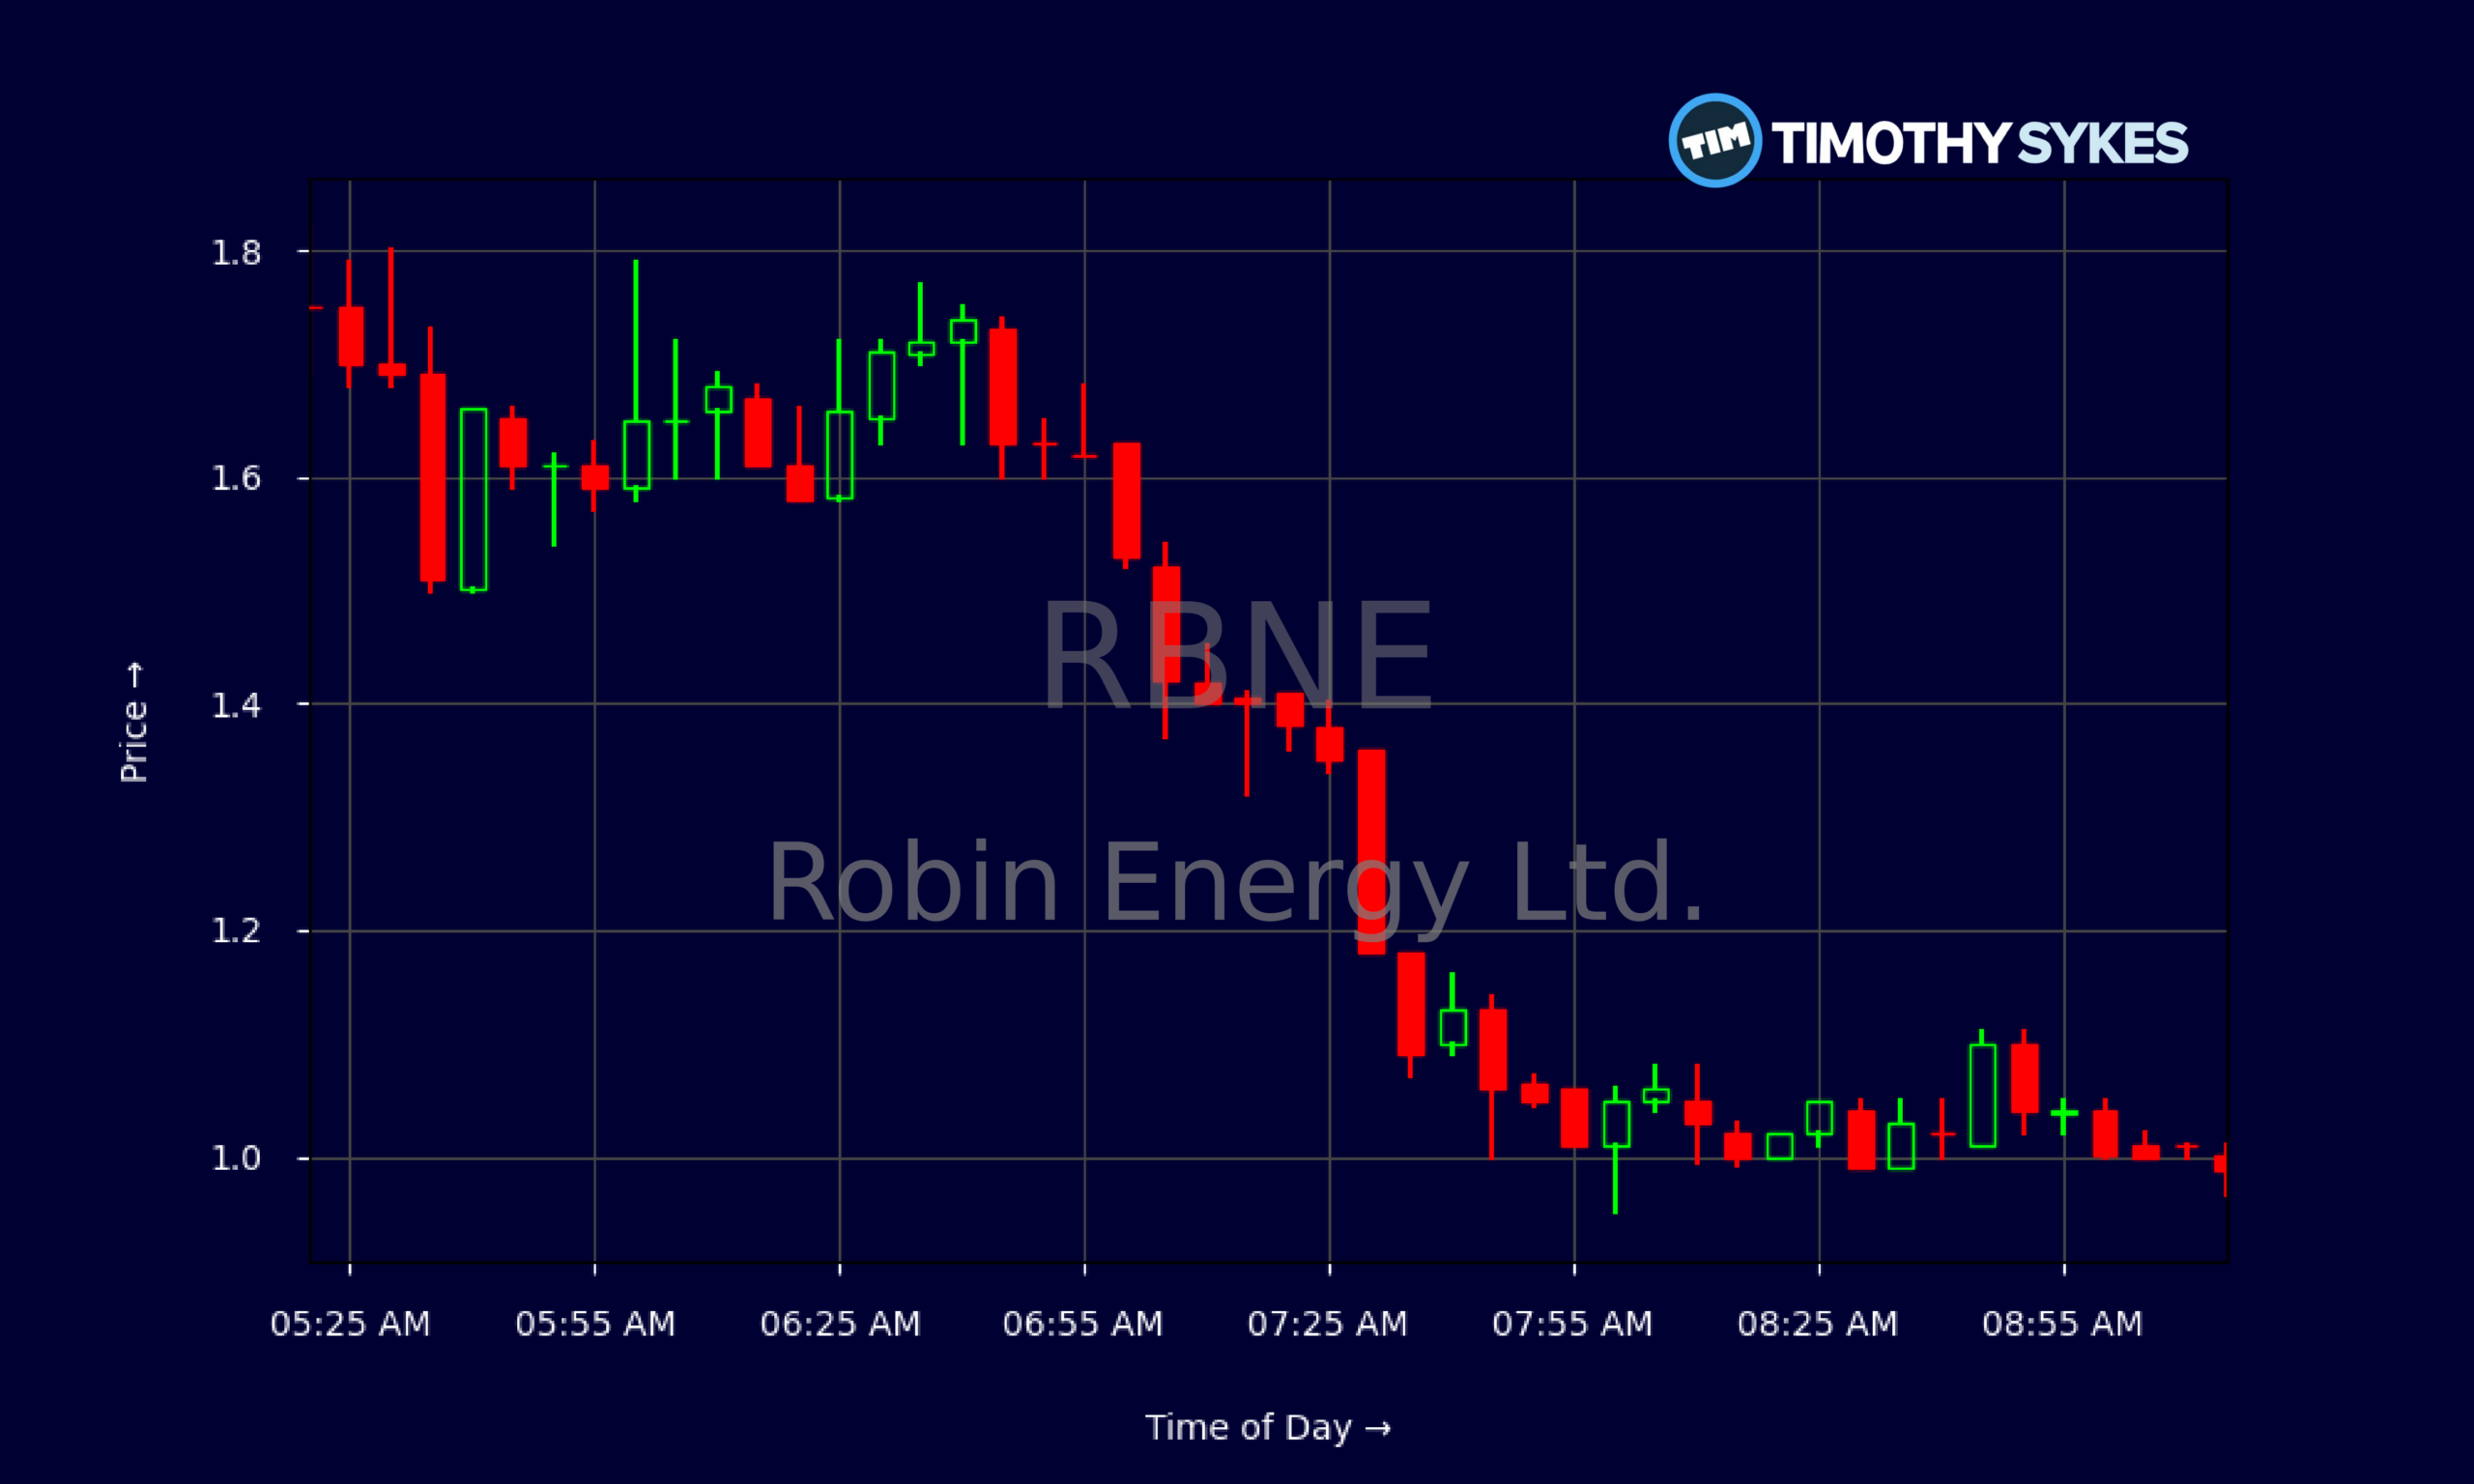
- Daily and intraday charts show heavy selling, failed bounces, and wide trading ranges that reward disciplined entries and quick exits.
- Robin Energy Ltd. reports around $9.9M in revenue and positive earnings, yet trades at a steep discount to its book value.
- RBNE carries a low price-to-sales and price-to-book ratio, suggesting traders are heavily discounting the company despite a sizable asset base.
Live Update At 09:19:23 EDT: On Wednesday, October 21, 2026 Robin Energy Ltd. stock [NASDAQ: RBNE] is trending up by 148.39%! Discover the key drivers behind this movement as well as our expert analysis in the detailed breakdown below.
Quick Financial Overview
Robin Energy Ltd., trading under ticker RBNE, is a classic example of a tiny company with big numbers on paper and a wild chart in real time. The latest income statement shows total revenue near $5.4M for the quarter and $9.9M over the trailing period, with RBNE generating a modest pretax profit margin of 5.7%. Net income sits in the low six figures, so the business is not a disaster from an earnings standpoint.
What jumps out for many traders is valuation. RBNE shows book value per share around 33.84, yet the stock is trading well below $1 after the latest slide. With a price‑to‑sales ratio around 0.55 and price‑to‑book at roughly 0.07, Robin Energy Ltd. is priced like the market doesn’t trust those assets or that cash flow.
More Breaking News
On the balance sheet, RBNE lists about $23.7M in cash and over $74M in total assets, against only roughly $3.2M in total liabilities. Leverage appears modest, and free cash flow is positive. For traders, that disconnect between strong reported balance sheet and a broken chart is the whole story: the numbers look sturdy, sentiment does not.
Why Traders Are Watching RBNE’s Violent Reversal
The daily chart on RBNE reads like a lesson in how fast momentum can flip. Earlier in the month, Robin Energy Ltd. was grinding above $2.30, holding closes in the $2.25–$2.39 area. For a thinly traded small-cap, that slow grind often sucks in late buyers. Then the floor gave out.
From 2026/10/16 onward, RBNE went into freefall. The stock opened near $1.82 and closed at $0.78 that day, then followed with more downside, ultimately closing around $0.40 by 2026/10/20. That is a brutal multi-day fade of more than 80% from recent highs. Robin Energy Ltd. price action screams forced selling, trapped longs, and day traders piling on the downside.
The intraday 5‑minute chart tells the same story in compressed form. RBNE spiked from roughly $0.47 at 04:00 up toward $2.07 within the first hour — then spent the rest of the session unwinding that spike. Every bounce faded. Lower highs rolled in from $2.02 to the $1.70s, then the $1.40s, then near $1.00. For Robin Energy Ltd. intraday scalpers, it was a textbook pattern of morning panic/short chase, midday chop, and afternoon exhaustion.
Traders are watching RBNE because this kind of compressed boom‑and‑bust move often creates secondary opportunities. Robin Energy Ltd. has enough volume and range for serious day trading, yet the chart demands strict rules. Chasing strength on RBNE has been punished; fading parabolic moves and cutting losses fast has been rewarded.
Conclusion
RBNE sits at an odd crossroads: on paper, Robin Energy Ltd. reports real revenue, positive earnings, strong cash, and an apparently clean balance sheet. In the market, the stock has been treated like a broken story, with price knifing from over $2.30 to sub‑$0.40 in days. That kind of disconnect is exactly where short‑term traders thrive, as long as they respect the risk.
For active traders, RBNE is not about believing a long‑term narrative. It is about reacting to clear levels and understanding how other players are trapped. Recent highs near $2.30 and intraday spikes toward $2.00 become obvious resistance zones, while the $0.35–$0.40 area is where Robin Energy Ltd. has tried to stabilize. If RBNE holds those lows, bounces can attract momentum longs and short covers. If it cracks, another wave of selling is on the table.
The key is staying process‑driven. Tim Sykes hammers one rule again and again: “Cut losses quickly; that’s how you stay in the game long enough to catch the big winners.” Just as important, he warns against emotional trading — as millionaire penny stock trader and teacher Tim Sykes, says, “There is always another play around the corner; don’t chase just because you feel FOMO.”. RBNE’s chart is a live example of why that rule matters. Robin Energy Ltd. offers big swings, both ways. Traders studying RBNE’s price action, volume, and levels — and treating every trade as a planned risk, not a hope — are using this volatility as a classroom for real‑world strategy, not as a promise of future profit.
This is stock news, not investment advice. Timothy Sykes News delivers real-time stock market news focused on key catalysts driving short-term price movements. Our content is tailored for active traders and investors seeking to capitalize on rapid price fluctuations, particularly in volatile sectors like penny stocks. Readers come to us for detailed coverage on earnings reports, mergers, FDA approvals, new contracts, and unusual trading volumes that can trigger significant short-term price action. Some users utilize our news to explain sudden stock movements, while others rely on it for diligent research into potential investment opportunities.
Dive deeper into the world of trading with Timothy Sykes, renowned for his expertise in penny stocks. Explore his top picks and discover the strategies that have propelled him to success with these articles:
- Penny Stocks Trading Guide
- Best Penny Stocks Under $1 to Buy Today
- Top 8 Penny Stocks to Watch on Robinhood
Once you’ve got some stocks on watch, elevate your trading game with StocksToTrade the ultimate platform for traders. With specialized tools for swing and day trading, StocksToTrade will guide you through the market’s twists and turns.
Dig into StocksToTrade’s watchlists here:





Leave a reply