

10x Genomics Inc. stocks have been trading down by -4.05 percent amid concerns over weakening demand and slower revenue growth
Market Insights For TXG Traders
- Shares slid 13.4% in a single session to $84.67, signaling heavy downside pressure and shaken confidence among short-term traders.
- Recent weekly prices around the low $70s now sit well below that selloff close, showing continued weakness after the sharp drop.
- Intraday action with a $71.91 open and rapid flush toward the high $60s reflects aggressive selling and elevated intraday volatility.
- Strong gross margin and cash levels contrast with ongoing losses, creating a classic high-growth but high-risk trading profile.
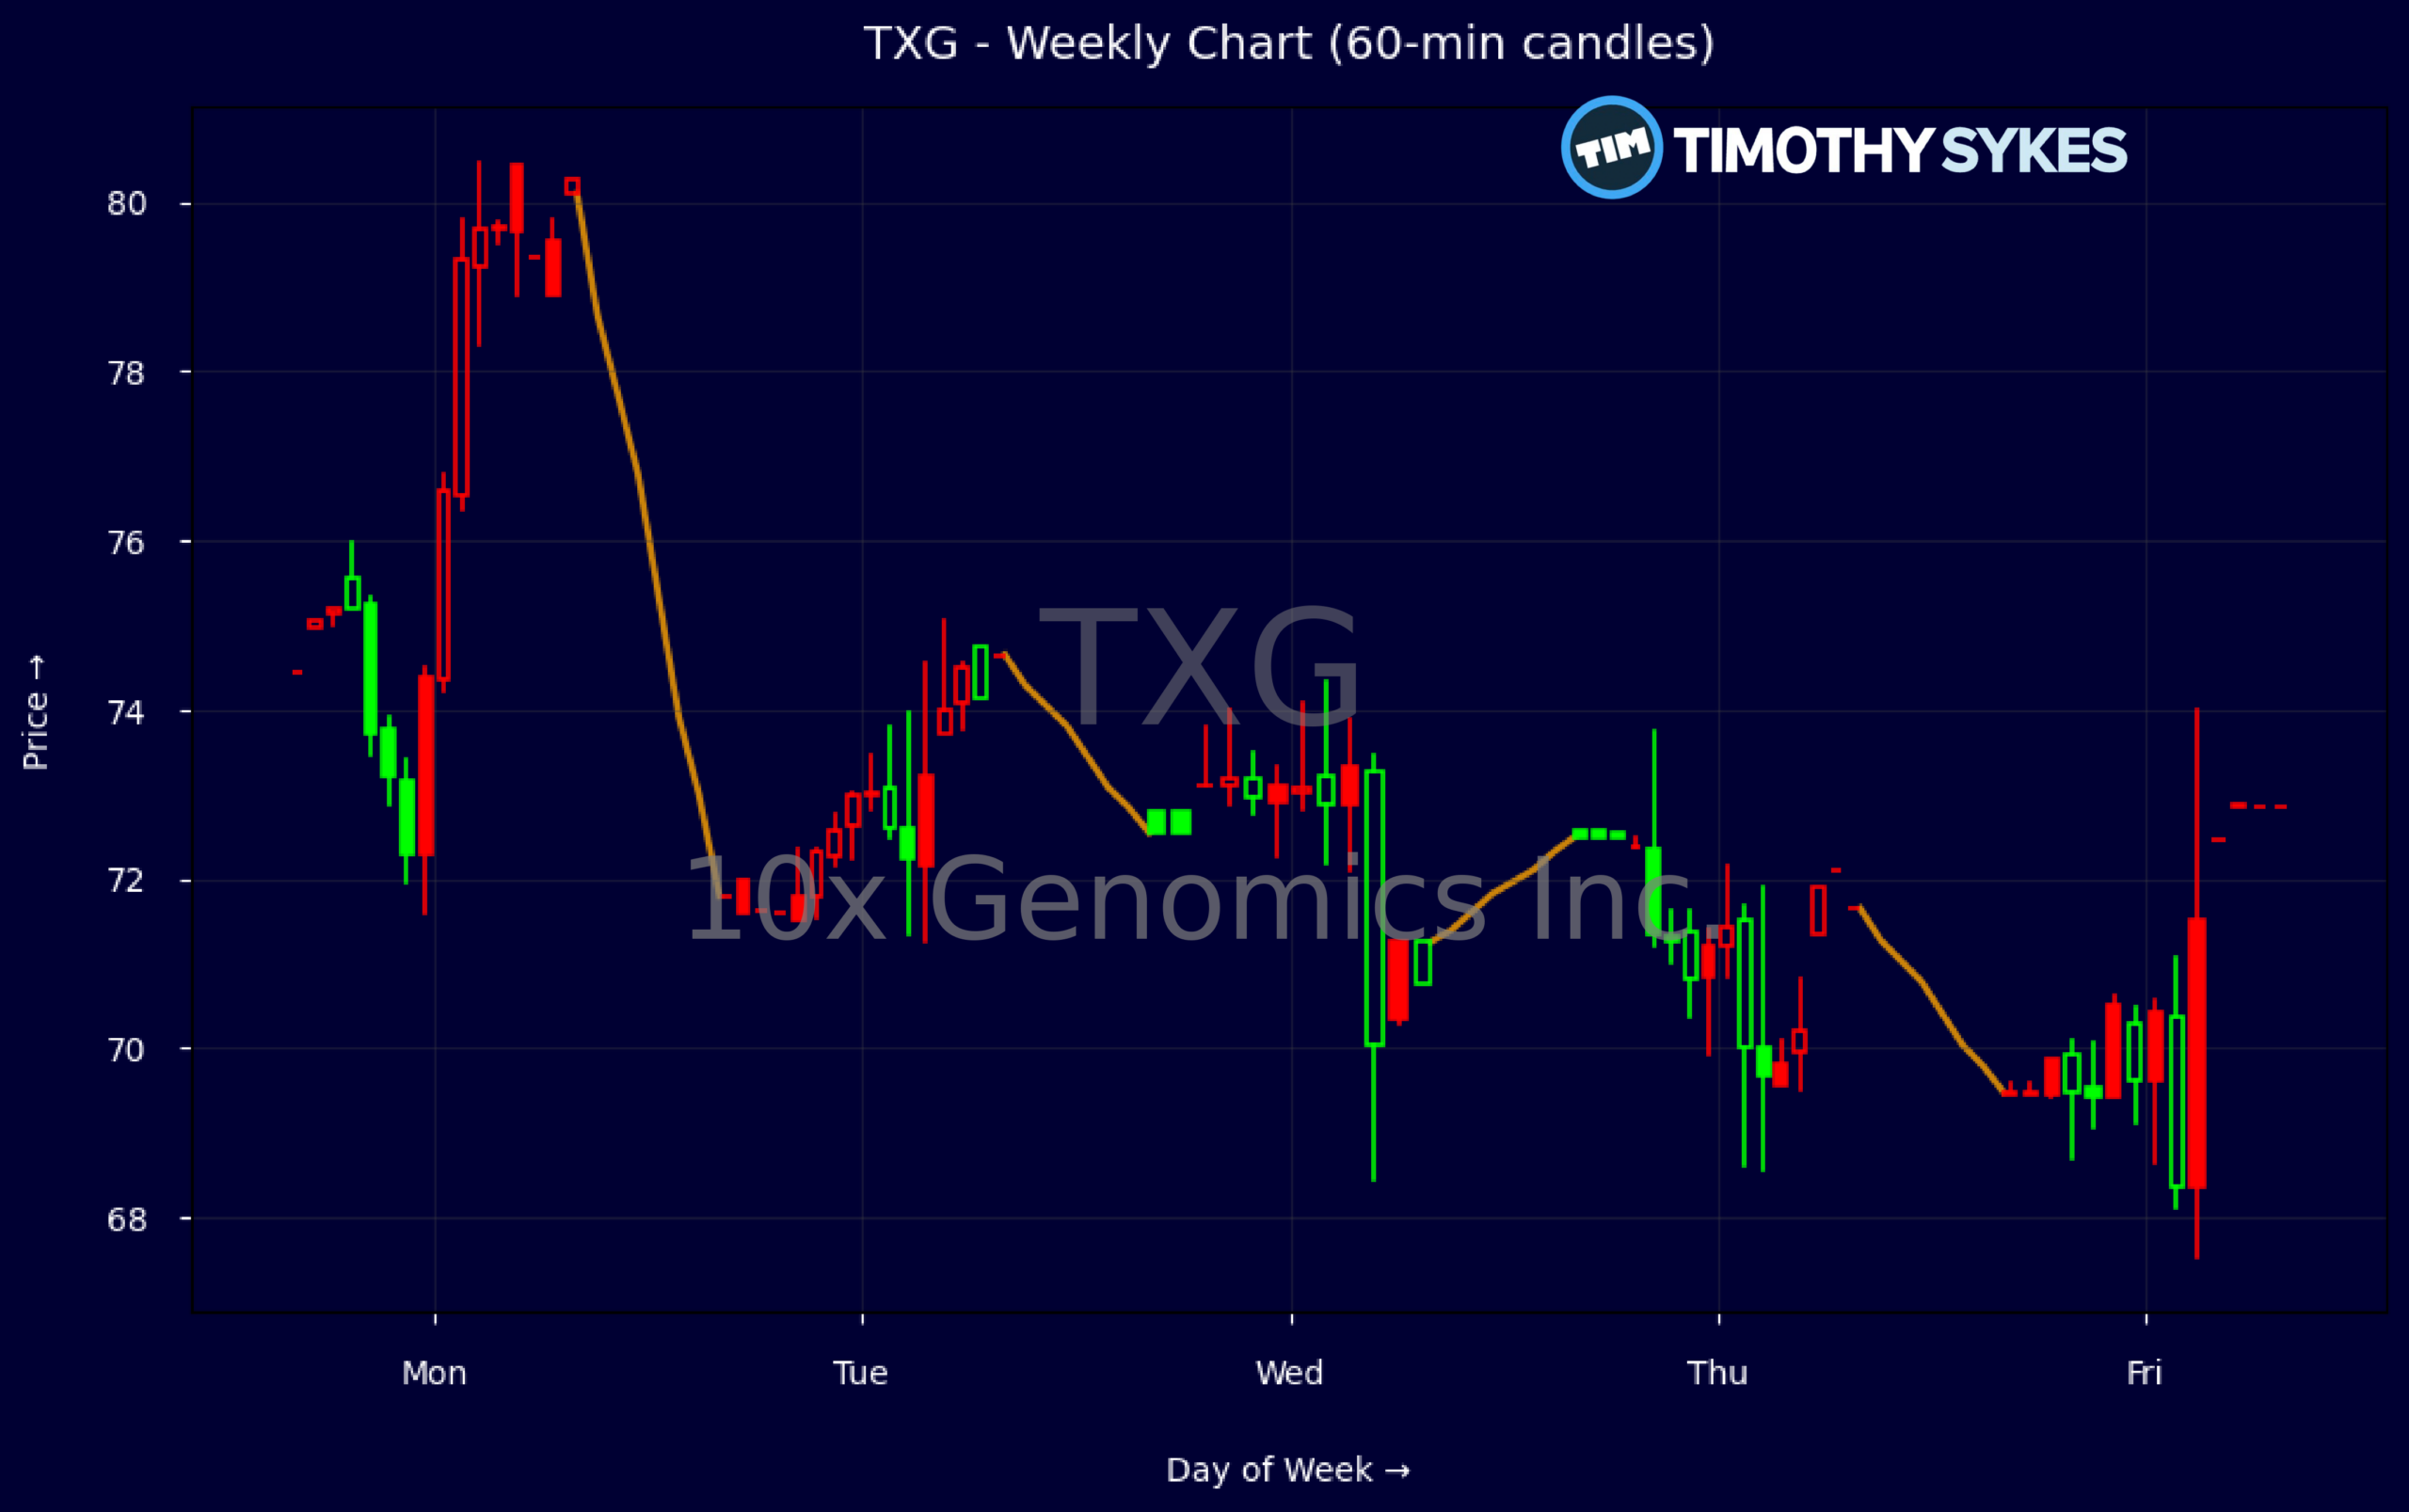
Weekly Update Oct 12 – Oct 16, 2026: On Sunday, October 18, 2026 10x Genomics Inc. stock [NASDAQ: TXG] is trending down by -4.05%! Discover the key drivers behind this movement as well as our expert analysis in the detailed breakdown below.
Healthcare industry expert:
Analyst sentiment – negative
10x Genomics (TXG) remains a category leader in single-cell and spatial genomics with strong 70% gross margins and 3-year revenue CAGR near 3%, decelerating from 5-year 8–9% levels. However, profitability is weak: EBIT margin -12.8% and ROIC firmly negative, with retained losses of -$1.54B. Valuation is demanding at ~17x sales and ~13x book despite no P/E, but the balance sheet is solid with minimal leverage (debt/equity 0.1) and ample liquidity (current ratio 5.7, >$500M cash).
Technically, TXG is in a short-term corrective downtrend: the weekly sequence from 74.44 to 69.46 shows persistent lower highs and lower closes, confirming supply pressure after the recent sharp drop from the mid‑80s. Five‑minute candles exhibit heavy selling on down moves with higher relative volume, and an absence of strong intraday reversals. The key actionable level is $70: below it, traders should expect continued weakness toward $65; an aggressive long only makes sense above $74 with tight risk control.
The recent 13.4% single‑day selloff to the mid‑80s reflects rising concern over slowing growth and persistent losses, pressuring TXG versus broader Healthcare and Biotechnology & Life Sciences indices that currently favor profitable platforms. Near‑term sentiment is negative, but strategic demand from core academic and biopharma customers supports the long‑term story. I see near‑term resistance at $75–78, strong resistance near $85, and support at $65. Risk‑reward is unfavorable; maintain a cautious stance unless shares retest low‑60s.
More Breaking News
Quick Financial Overview
10x Genomics Inc. posted quarterly revenue of about $151.0M, with gross profit near $112.5M, which translates to a very strong 70% gross margin. That margin tells traders TXG can price its products well and control direct costs. The problem is further down the income statement, where heavy operating expenses drive an operating loss of roughly $23.0M and a net loss of about $17.9M for the quarter.
On a trailing basis, TXG shows about $642.8M in annual revenue, yet key profitability ratios remain firmly negative. Return on assets and return on equity are both below zero, confirming that 10x Genomics Inc. is still in a scale-up phase, not a steady-profit phase. Valuation is rich, with a price-to-sales ratio around 17.0 and very high price-to-cash-flow levels, which means traders are paying up for growth that is not yet hitting the bottom line.
The balance sheet, however, is a stabilizing factor. Cash and equivalents sit near $502.5M, with cash and short-term investments around $552.0M and total debt relatively modest near $66.8M. Liquidity looks strong, with a current ratio about 5.7 and quick ratio about 5.1, giving TXG room to fund losses and research. For short-term traders, that mix—negative earnings but strong cash—supports the idea of volatility trades rather than balance-sheet stress trades.
Conclusion
This is stock news, not investment advice. Timothy Sykes News delivers real-time stock market news focused on key catalysts driving short-term price movements. Our content is tailored for active traders and investors seeking to capitalize on rapid price fluctuations, particularly in volatile sectors like penny stocks. Readers come to us for detailed coverage on earnings reports, mergers, FDA approvals, new contracts, and unusual trading volumes that can trigger significant short-term price action. Some users utilize our news to explain sudden stock movements, while others rely on it for diligent research into potential investment opportunities.
Dive deeper into the world of trading with Timothy Sykes, renowned for his expertise in penny stocks. Explore his top picks and discover the strategies that have propelled him to success with these articles:
- Penny Stocks Trading Guide
- Best Penny Stocks Under $1 to Buy Today
- Top 8 Penny Stocks to Watch on Robinhood
Once you’ve got some stocks on watch, elevate your trading game with StocksToTrade the ultimate platform for traders. With specialized tools for swing and day trading, StocksToTrade will guide you through the market’s twists and turns.
Dig into StocksToTrade’s watchlists here:





Leave a reply