timothy sykes logo

Trading Lessons

Turn Panic into Profits

Timothy SykesAvatar
Written by Timothy Sykes
Updated 5/10/2022 6 min read

Hey Trader. Tim Here.

Nothing gets traders glued to their televisions like good, old-fashioned fear.

Financial news outlets love to gin up panic to get more eyeballs.

They parade pundits across the screen like the Westminster Dog Show.

Frankly, it’s shameful.

None of them bother to tell you the truth — panic creates opportunity on BOTH SIDES of the tape.

I teach this powerful concept to students early and often.

And right now, I want to show you how to apply it to your trading.

This universal idea works on everything from penny stocks to market indexes.

It’s so powerful that many of my top students are crushing it this year…

Compare these YTD figures to the S&P 500

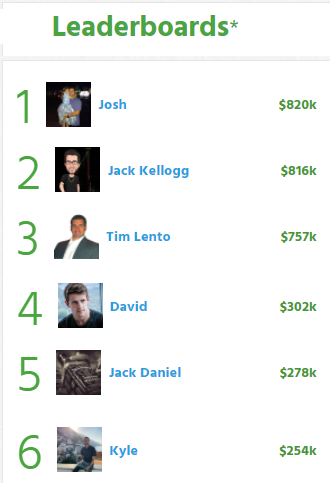
Here’s what’s interesting about this particular leaderboard.

Jack Kellogg and Kyle, the lead trainers in StocksToTrade’s Breakouts and Breakdowns, trade totally opposite from one another.

Jack’s primarily a long trader while Kyle prefers shorts.

But both of them understand how to use panic when creating trade setups.

It all starts with identifying capitulation.

Pinpointing Panic

Tim Sykes prepares for a potential market crash in 2022
© Millionaire Media, LLC

Have you ever been in a trade that gets so bad, that you give up, close out the position, and eat the losses?

Now imagine everyone doing that all at once.

That’s what capitulation means.

It’s that point where you get so many sellers (or buyers) at once that there’s no one left to sell (or buy) the stock.

This phenomenon can occur on any type of asset.

Take the SPDR S&P 500 ETF Trust (ARCX: SPY) daily chart for example:

In the last few months, there have been a few capitulation events where stocks bottomed on volume that was more than double the average.

When I say this concept works on any chart, I do mean ANY chart.

Look at how capitulation created a low for the day in Sysorex Inc. (OTC: SYSX), a stock I’ve traded several times in the past few weeks.

The volume in this late morning candlestick was nearly 5x the volume seen the rest of the day — and a bit less than double the volume from the open.

Keep in mind that the SPY chart was a daily chart while this is a 10-minute chart.

And this can work for short plays as well.

Check out how capitulation played out in Better Therapeutics Inc. (NASDAQ: BTTX), a stock that Tim Bohen and StocksToTrade Advisory nailed on the upside.

I think this is incredible…

This stock, which many traders played to the long side, created a clear capitulation top that a short trader could’ve used for a setup.

How many other concepts can you use to trade both sides of the tape?

Creating a Setup

trading patterns types
© Millionaire Media, LLC

Finding capitulation is fairly straightforward. You can use volume screeners to locate heavy trading in a particular stock.

The screener in our StocksToTrade platform does this incredibly well and allows you to filter tickers based on a stock’s float.

Ideally, you want the trading volume to be 2-3x or more than the average.

Intraday, it should be above the open volume by a significant amount (although it doesn’t necessarily have to be twice as much).

From there, you have two options…

First, you can wait for the next candle, with significantly lower volume, to take a position.

This is what that would look like in the chart above:

The problem is that you need to give the trade enough space to work, which can give you a larger drawdown than you prefer.

Second, you can wait for an obvious reversal after the capitulation moment, then use that as your entry point with the high (or low) as your stop.

Here’s what that would look like on the same chart:

This gives you a more defined setup with a clear risk/reward. However, you won’t always get as much potential profit as you might from a more aggressive entry.

Neither method is better than the other. It comes down to personal preference and context.

For example, if a stock experienced a Supernova pattern, there’s a lot of downside to cover. So, you can afford to wait for a crystal-clear topping signal before shorting the stock.

The Bottom Line

I don’t care who you are or what you trade … you MUST learn to identify and exploit panic.

Warren Buffet did it with Bank of America Corp. (NYSE: BAC) during the credit crisis.

This is how you can put the odds in your favor.

Supernovas are one of the easiest patterns to see this happen.

This single pattern helped me earn my first million.

And it’s a great place to start.

Click here to learn more about Supernova patterns.


—TIM


How much has this post helped you?


Leave a reply


Author card Timothy Sykes picture

Timothy Sykes

Tim Sykes is a penny stock trader and teacher who became a self-made millionaire by the age of 22 by trading $12,415 of bar mitzvah money. After becoming disenchanted with the hedge fund world, he established the Tim Sykes Trading Challenge to teach aspiring traders how to follow his trading strategies. He’s been featured in a variety of media outlets including CNN, Larry King, Steve Harvey, Forbes, Men’s Journal, and more. He’s also an active philanthropist and environmental activist, a co-founder of Karmagawa, and has donated millions of dollars to charity. Read More

Post image

Get my weekly watchlist, free

Sign up to jump start your trading education!

* Results are not typical and will vary from person to person. Making money trading stocks takes time, dedication, and hard work. There are inherent risks involved with investing in the stock market, including the loss of your investment. Past performance in the market is not indicative of future results. Any investment is at your own risk. See Terms of Service here

The available research on day trading suggests that most active traders lose money. Fees and overtrading are major contributors to these losses.

A 2000 study called “Trading is Hazardous to Your Wealth: The Common Stock Investment Performance of Individual Investors” evaluated 66,465 U.S. households that held stocks from 1991 to 1996. The households that traded most averaged an 11.4% annual return during a period where the overall market gained 17.9%. These lower returns were attributed to overconfidence.

A 2014 paper (revised 2019) titled “Learning Fast or Slow?” analyzed the complete transaction history of the Taiwan Stock Exchange between 1992 and 2006. It looked at the ongoing performance of day traders in this sample, and found that 97% of day traders can expect to lose money from trading, and more than 90% of all day trading volume can be traced to investors who predictably lose money. Additionally, it tied the behavior of gamblers and drivers who get more speeding tickets to overtrading, and cited studies showing that legalized gambling has an inverse effect on trading volume.

A 2019 research study (revised 2020) called “Day Trading for a Living?” observed 19,646 Brazilian futures contract traders who started day trading from 2013 to 2015, and recorded two years of their trading activity. The study authors found that 97% of traders with more than 300 days actively trading lost money, and only 1.1% earned more than the Brazilian minimum wage ($16 USD per day). They hypothesized that the greater returns shown in previous studies did not differentiate between frequent day traders and those who traded rarely, and that more frequent trading activity decreases the chance of profitability.

These studies show the wide variance of the available data on day trading profitability. One thing that seems clear from the research is that most day traders lose money .

Millionaire Media 66 W Flagler St. Ste. 900 Miami, FL 33130 United States (888) 878-3621 This is for information purposes only as Millionaire Media LLC nor Timothy Sykes is registered as a securities broker-dealer or an investment adviser. No information herein is intended as securities brokerage, investment, tax, accounting or legal advice, as an offer or solicitation of an offer to sell or buy, or as an endorsement, recommendation or sponsorship of any company, security or fund. Millionaire Media LLC and Timothy Sykes cannot and does not assess, verify or guarantee the adequacy, accuracy or completeness of any information, the suitability or profitability of any particular investment, or the potential value of any investment or informational source. The reader bears responsibility for his/her own investment research and decisions, should seek the advice of a qualified securities professional before making any investment, and investigate and fully understand any and all risks before investing. Millionaire Media LLC and Timothy Sykes in no way warrants the solvency, financial condition, or investment advisability of any of the securities mentioned in communications or websites. In addition, Millionaire Media LLC and Timothy Sykes accepts no liability whatsoever for any direct or consequential loss arising from any use of this information. This information is not intended to be used as the sole basis of any investment decision, nor should it be construed as advice designed to meet the investment needs of any particular investor. Past performance is not necessarily indicative of future returns.

Citations for Disclaimer

Barber, Brad M. and Odean, Terrance, Trading is Hazardous to Your Wealth: The Common Stock Investment Performance of Individual Investors. Available at SSRN: “Day Trading for a Living?”

Barber, Brad M. and Lee, Yi-Tsung and Liu, Yu-Jane and Odean, Terrance and Zhang, Ke, Learning Fast or Slow? (May 28, 2019). Forthcoming: Review of Asset Pricing Studies, Available at SSRN: “https://ssrn.com/abstract=2535636”

Chague, Fernando and De-Losso, Rodrigo and Giovannetti, Bruno, Day Trading for a Living? (June 11, 2020). Available at SSRN: “https://ssrn.com/abstract=3423101”