timothy sykes logo

Trading Lessons

Avoid the Trading Value Trap Fallacy

Timothy SykesAvatar
Written by Timothy Sykes
Updated 9/27/2022 6 min read

Market crashes can create once-in-a-lifetime opportunities.

Stocks become incredibly cheap, with some trading at prices they haven’t seen in over 20 years.

But traders need to be careful they don’t fall into what I call the ‘Trading Value Trap Fallacy.’

While fundamental investors get sucked in by a stock with a cheap price-to-earnings (P/E) ratio, traders get sucked in by huge price drops.

They see a stock down 50% and think it can’t possibly go any lower.

So, they scoop up shares…except there’s one problem…

Where do you put the stop?

Unless you have a clear methodology, as I do with my panic dip buys, you’ll end up picking some random spot, and that’s not a recipe for success.

Instead, let me show you how to avoid the trading value trap and identify the BEST spots to make your stand.

This will help you make tighter trades on penny stocks and can even be applied to market swings.

Context Matters

frequenly asked questions about stock chart patterns
© Millionaire Media, LLC

All hell breaks loose when the S&P 500 drops 5% in one day.

I’d barely notice if a Supernova penny stock pulls back 5%.

Pullbacks are relative.

I screen for stocks moving +30% intraday for my trades.

That way, I can aim for 5%-10% gains and not be out of line.

However, I also look at how long the move takes.

Take a look at Protext Pharma Inc. (OTC: TXTM).

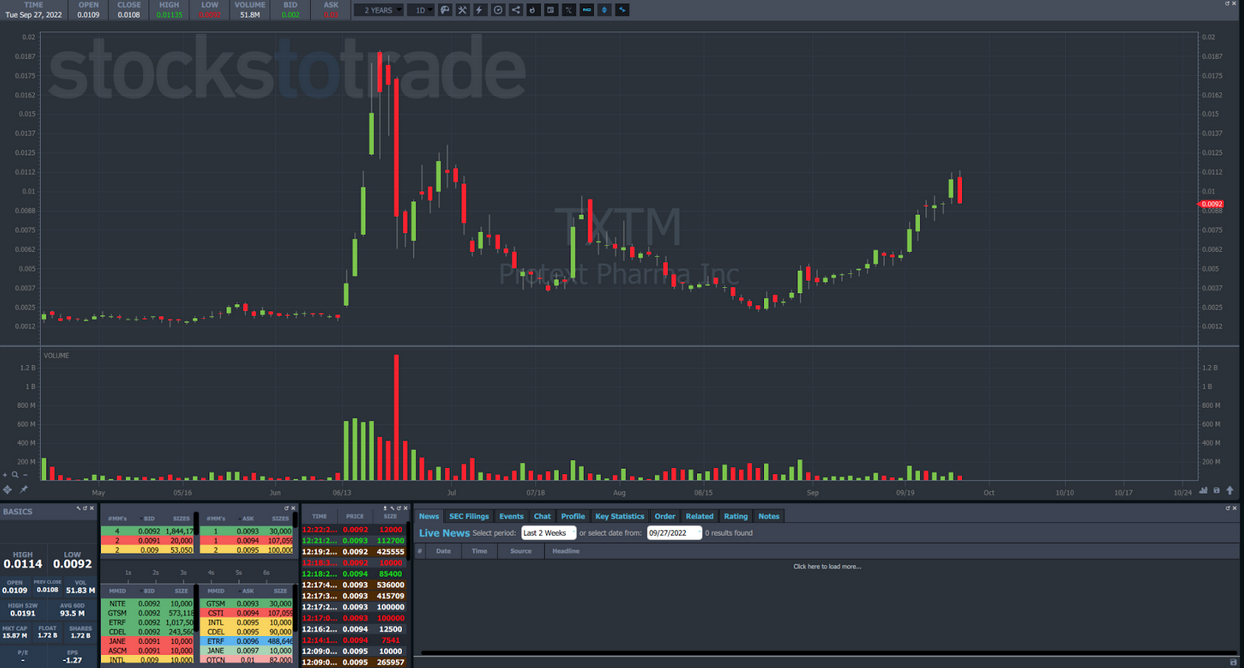
This pattern fits perfectly into my 7-step penny stock framework.

When price flies into the stratosphere, it gains +855% in a week.

The pullbacks on the topping red candles drop as much as 36% intraday.

The 3rd red candle which broke the longs fell more than 50% at its worst…

And that wasn’t even the bottom.

The stock didn’t catch a bounce until two days later.

Supernova patterns work on the speed and magnitude of price changes.

These aren’t likely to happen to the S&P 500 on a day to day basis.

But that doesn’t mean they can’t on a larger scale.

When the dotcom bubble exploded, the Nasdaq Composite Index looked exactly like every other Supernova.

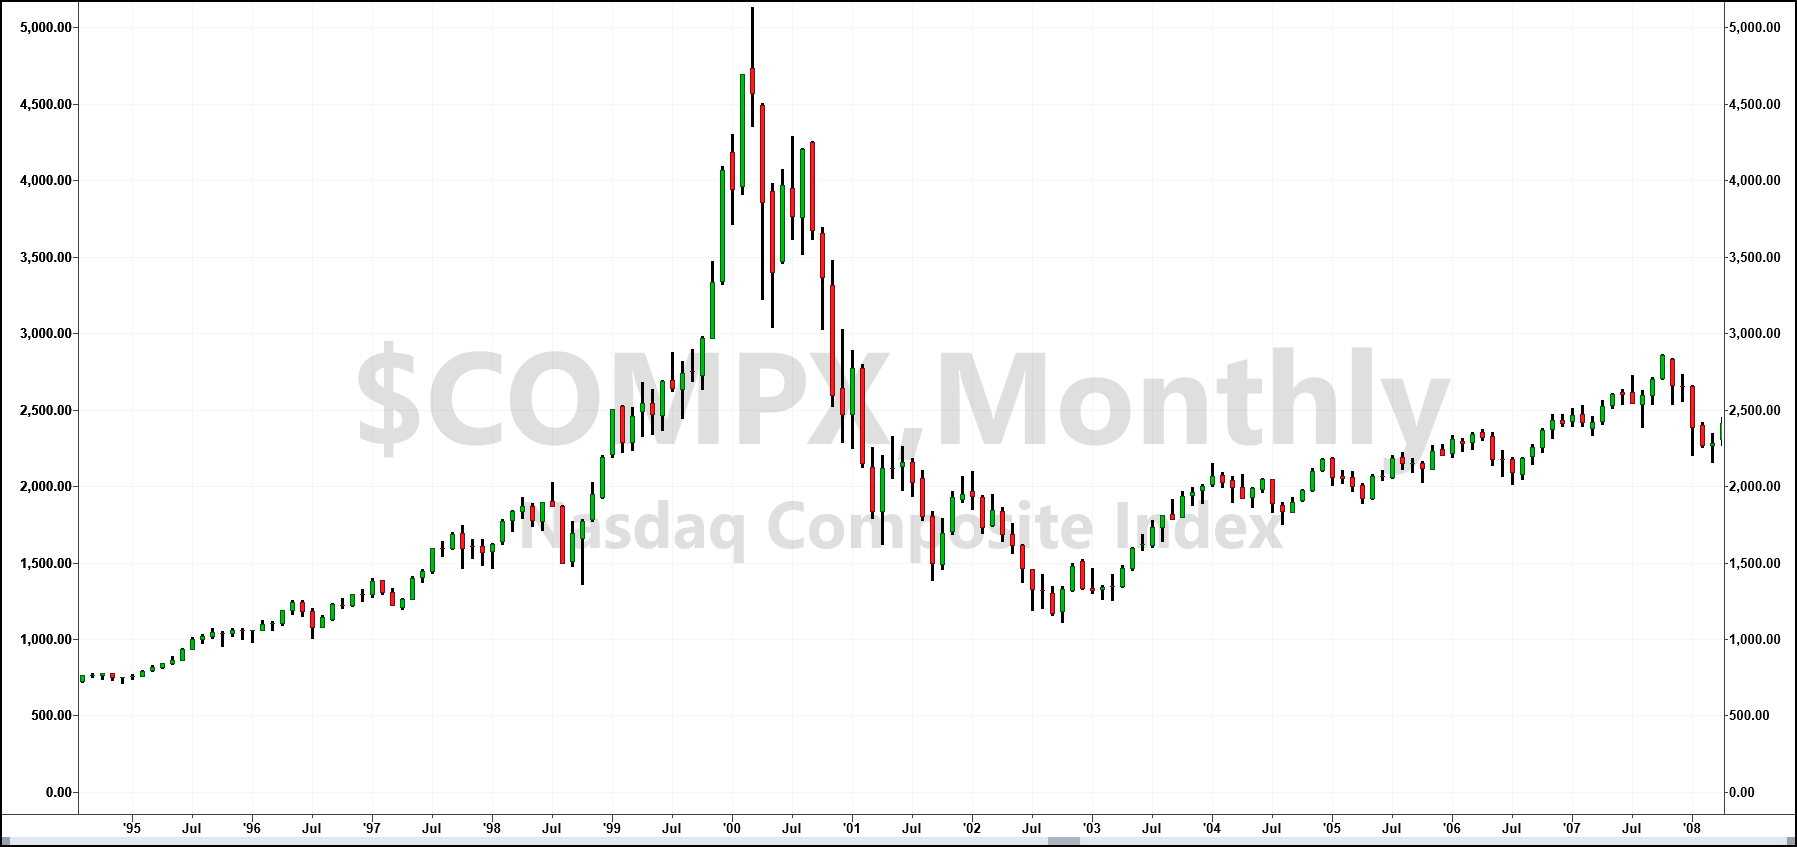
The only difference was it didn’t fade into oblivion.

However, it saw a 40% correction before it caught a significant bounce. And that was still well before it found its low.

Markets may take longer, but they make the same patterns we find in penny stocks.

What Makes a Good Support

sykes thumbs up
© Millionaire Media, LLC

There are dozens of ways to find support and resistance levels.

The easiest are to look for previous highs, lows, gaps, or areas of consolidation.

It doesn’t need to get more complicated than that.

I identify these spots before a stock starts to collapse.

However, I don’t just jump in once the price gets to my level.

The key is to watch price action.

I want to see sellers give up and buyers take over.

This looks the same whether you use a 1-minute chart on a penny stock or a monthly chart on the S&P 500.

The only difference is the relative movement.

Here’s an example.

Global Tech Industries Group Inc. (OTC: GTII) is a former Supernova that caught a bid several days ago.

Shares more than doubled in a day before pulling back almost 40%.

In the 1-minute chart below, I identified two possible support levels based on the prior day’s price action.

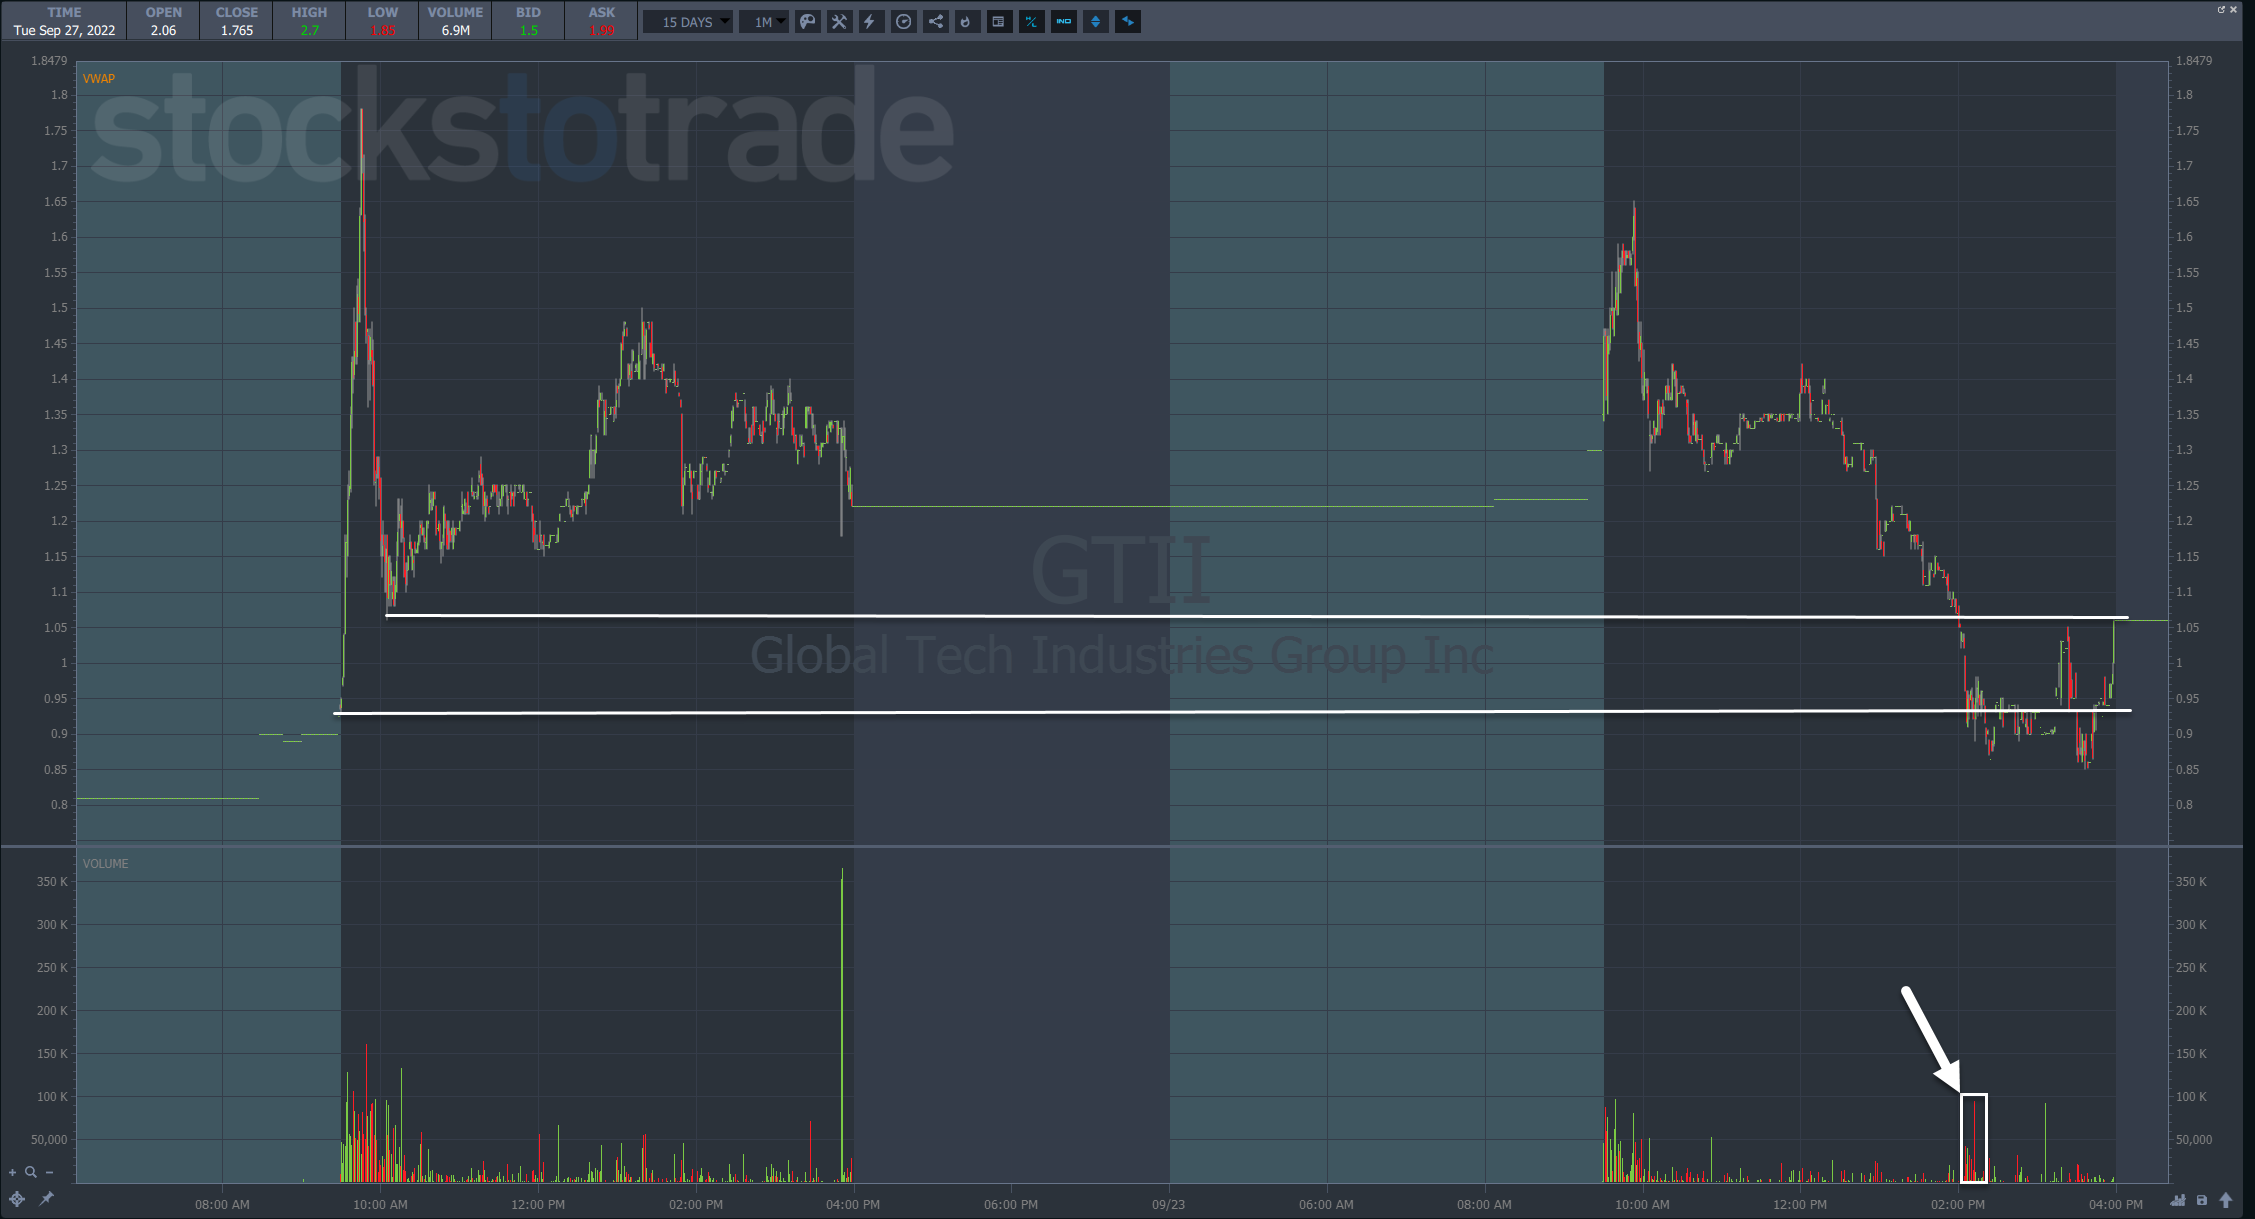
I want to zoom in on the boxed-in area where volume picked up.

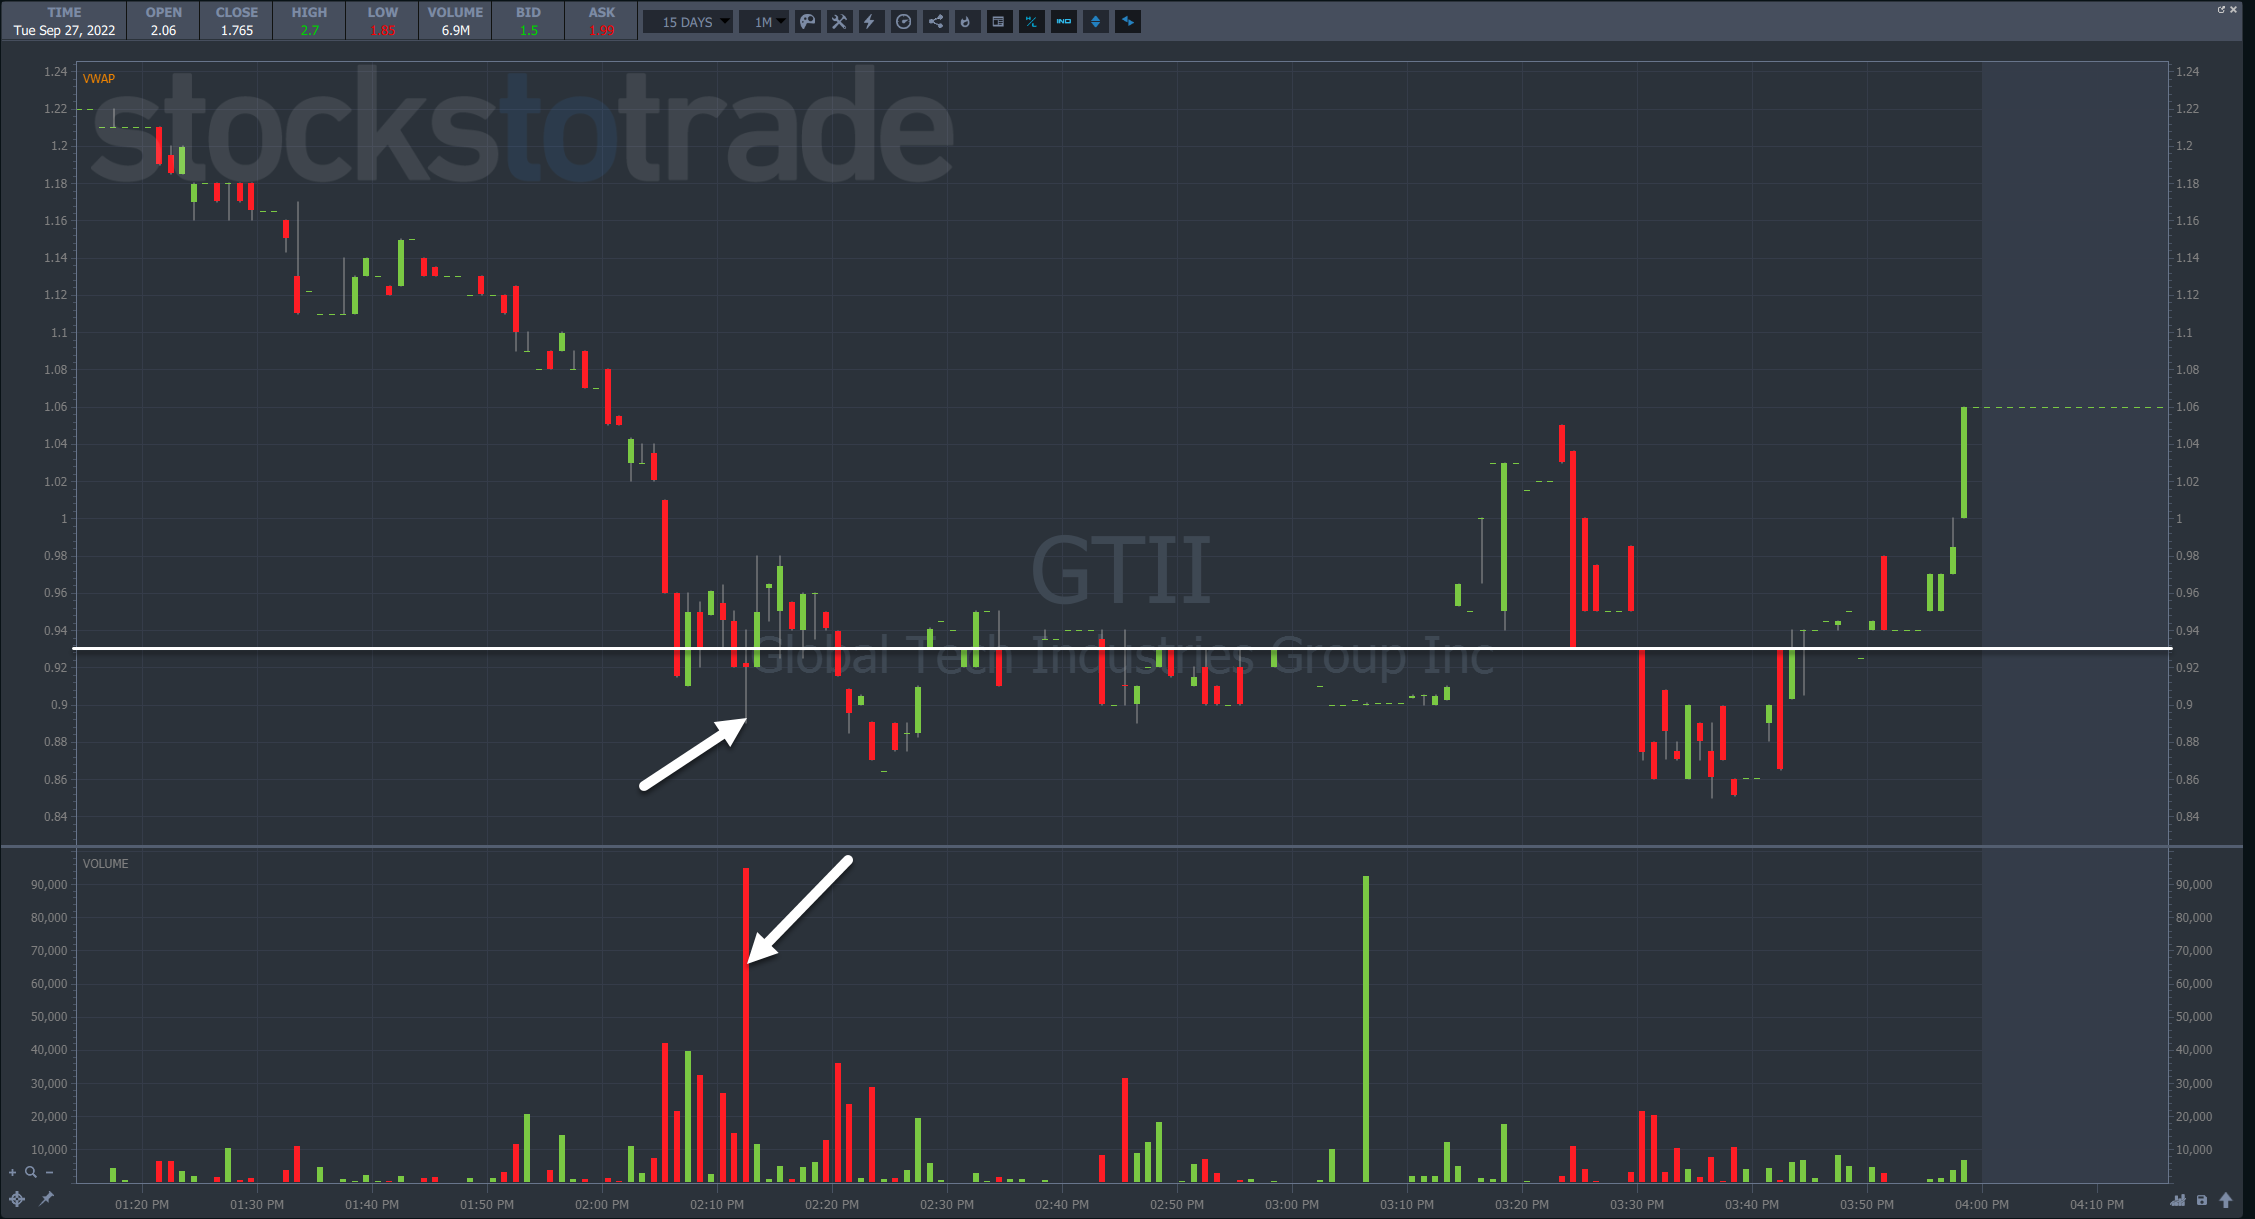
The first support level didn’t work as shares cut through.

But when price got to that support level, volume jumped, culminating with a reversal candle on the highest volume since the open.

All things being equal, this is a legitimate spot to take a long trade.

This is what I mean when I talk about price action. It’s looking for confirmation from the volume and price movement.

You can see the same concept in action on the S&P 500 ETF (NYSE: SPY) in 2019.

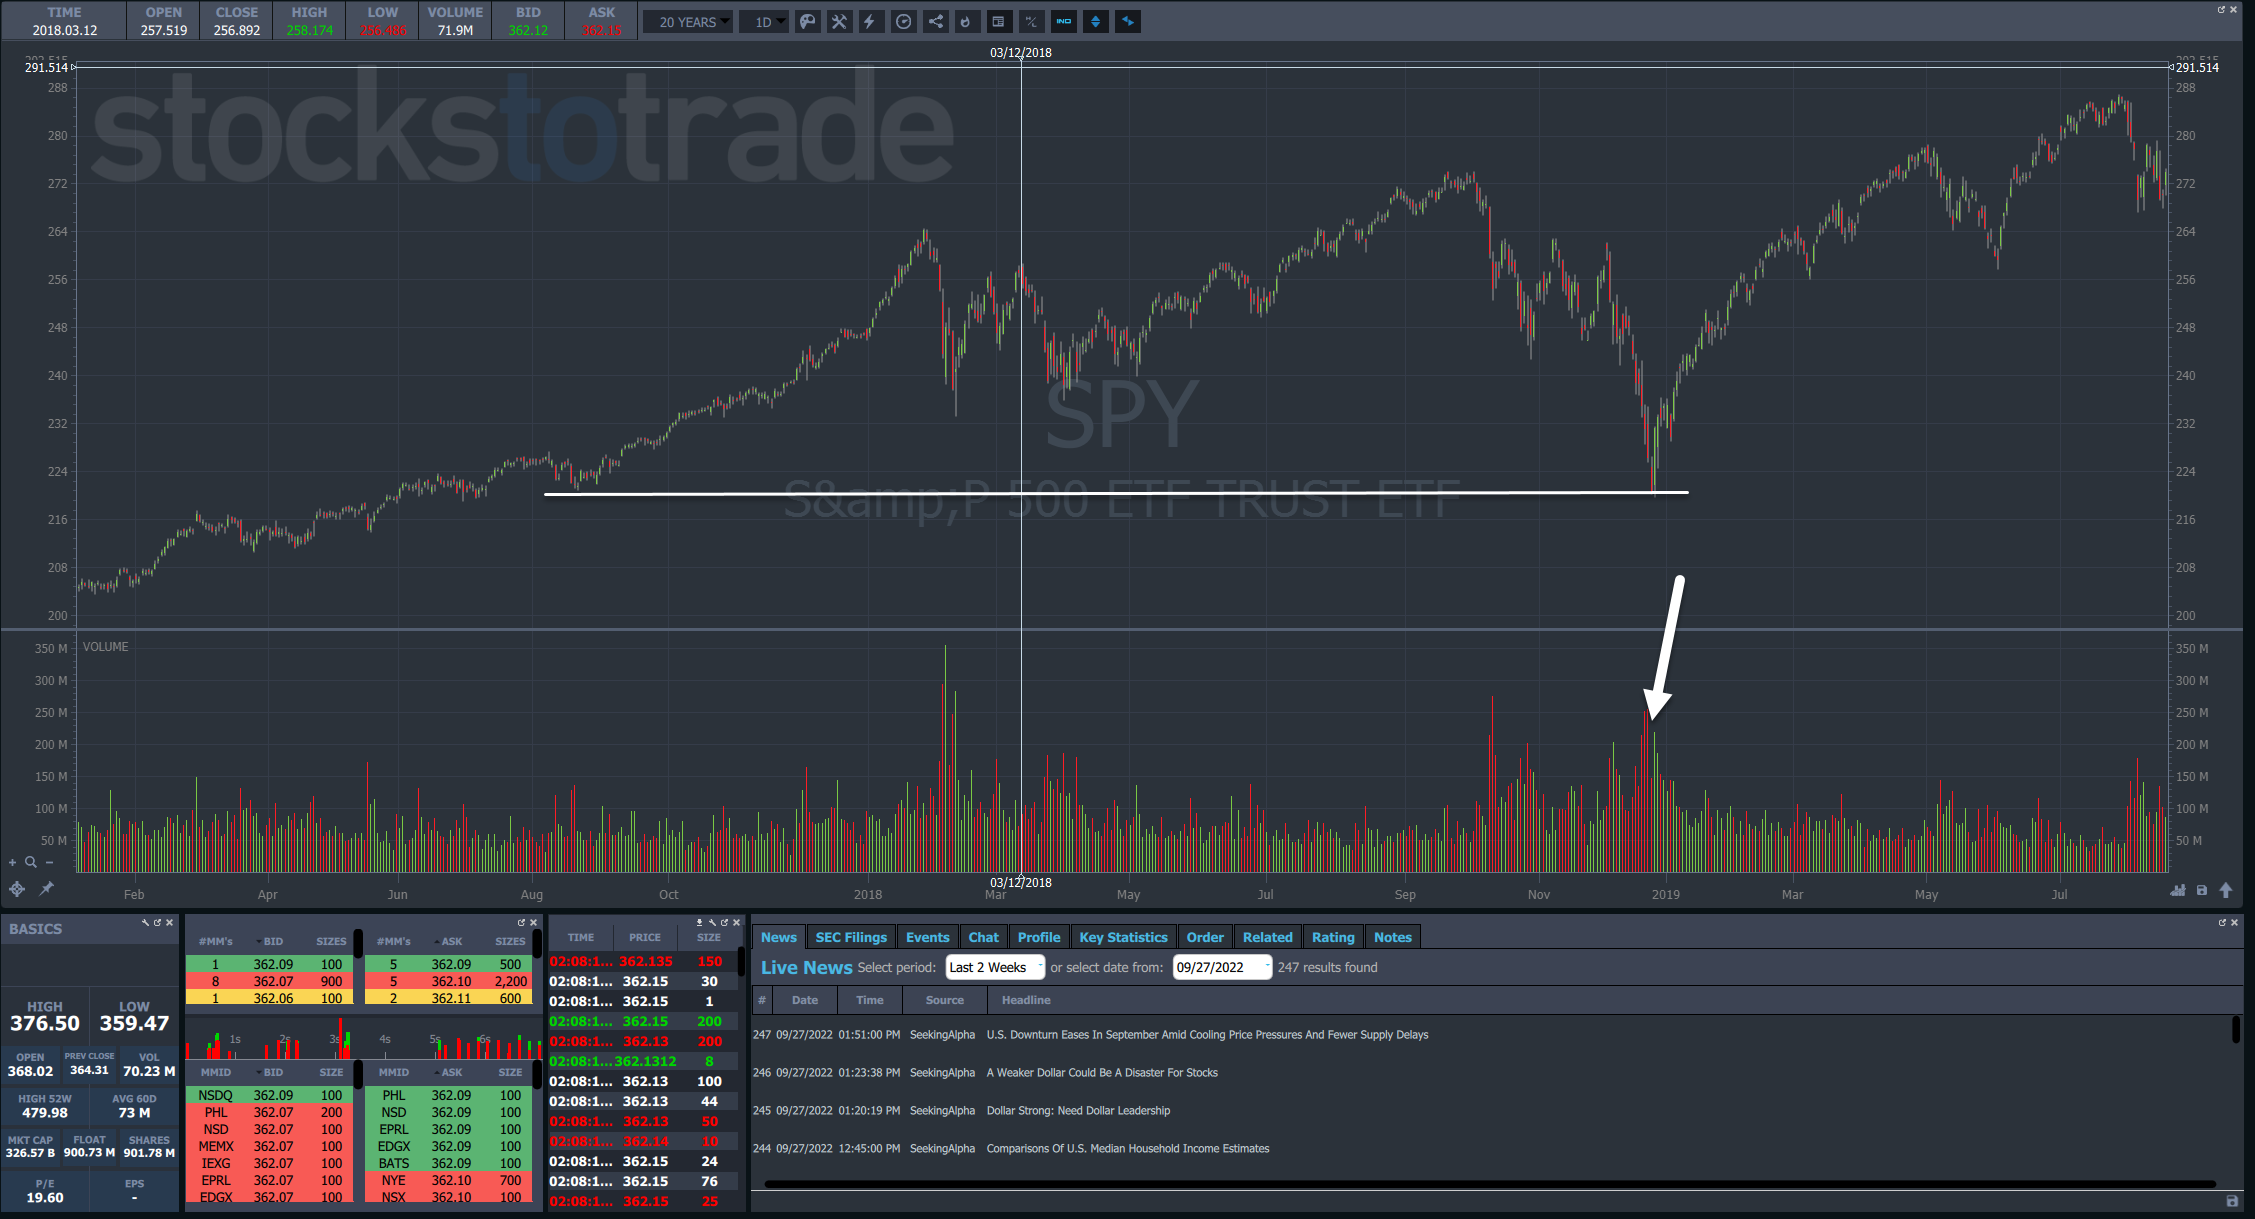
Shares plunged into a support level, saw heavy volume, and then flipped around.

There are two important differences to keep in mind.

First, I can scour the market for penny stocks that fit my pattern, but there is only one S&P 500 index. So, you can’t pick and choose there.

Second, the price action isn’t always so obvious with larger cap stocks and indexes.

The reversals are more subtle and aren’t as likely to see massive spikes in volume that you might find in an OTC.

Nonetheless, the same principles apply.

But you can make life easier on yourself.

Learn my #1 pattern that repeats again and again, no matter what the market does.

Let others worry about their 401K.

Click here and check out my Supernova pattern.

–Tim


How much has this post helped you?


Leave a reply


Author card Timothy Sykes picture

Timothy Sykes

Tim Sykes is a penny stock trader and teacher who became a self-made millionaire by the age of 22 by trading $12,415 of bar mitzvah money. After becoming disenchanted with the hedge fund world, he established the Tim Sykes Trading Challenge to teach aspiring traders how to follow his trading strategies. He’s been featured in a variety of media outlets including CNN, Larry King, Steve Harvey, Forbes, Men’s Journal, and more. He’s also an active philanthropist and environmental activist, a co-founder of Karmagawa, and has donated millions of dollars to charity. Read More

Post image

Get my weekly watchlist, free

Sign up to jump start your trading education!

* Results are not typical and will vary from person to person. Making money trading stocks takes time, dedication, and hard work. There are inherent risks involved with investing in the stock market, including the loss of your investment. Past performance in the market is not indicative of future results. Any investment is at your own risk. See Terms of Service here

The available research on day trading suggests that most active traders lose money. Fees and overtrading are major contributors to these losses.

A 2000 study called “Trading is Hazardous to Your Wealth: The Common Stock Investment Performance of Individual Investors” evaluated 66,465 U.S. households that held stocks from 1991 to 1996. The households that traded most averaged an 11.4% annual return during a period where the overall market gained 17.9%. These lower returns were attributed to overconfidence.

A 2014 paper (revised 2019) titled “Learning Fast or Slow?” analyzed the complete transaction history of the Taiwan Stock Exchange between 1992 and 2006. It looked at the ongoing performance of day traders in this sample, and found that 97% of day traders can expect to lose money from trading, and more than 90% of all day trading volume can be traced to investors who predictably lose money. Additionally, it tied the behavior of gamblers and drivers who get more speeding tickets to overtrading, and cited studies showing that legalized gambling has an inverse effect on trading volume.

A 2019 research study (revised 2020) called “Day Trading for a Living?” observed 19,646 Brazilian futures contract traders who started day trading from 2013 to 2015, and recorded two years of their trading activity. The study authors found that 97% of traders with more than 300 days actively trading lost money, and only 1.1% earned more than the Brazilian minimum wage ($16 USD per day). They hypothesized that the greater returns shown in previous studies did not differentiate between frequent day traders and those who traded rarely, and that more frequent trading activity decreases the chance of profitability.

These studies show the wide variance of the available data on day trading profitability. One thing that seems clear from the research is that most day traders lose money .

Millionaire Media 66 W Flagler St. Ste. 900 Miami, FL 33130 United States (888) 878-3621 This is for information purposes only as Millionaire Media LLC nor Timothy Sykes is registered as a securities broker-dealer or an investment adviser. No information herein is intended as securities brokerage, investment, tax, accounting or legal advice, as an offer or solicitation of an offer to sell or buy, or as an endorsement, recommendation or sponsorship of any company, security or fund. Millionaire Media LLC and Timothy Sykes cannot and does not assess, verify or guarantee the adequacy, accuracy or completeness of any information, the suitability or profitability of any particular investment, or the potential value of any investment or informational source. The reader bears responsibility for his/her own investment research and decisions, should seek the advice of a qualified securities professional before making any investment, and investigate and fully understand any and all risks before investing. Millionaire Media LLC and Timothy Sykes in no way warrants the solvency, financial condition, or investment advisability of any of the securities mentioned in communications or websites. In addition, Millionaire Media LLC and Timothy Sykes accepts no liability whatsoever for any direct or consequential loss arising from any use of this information. This information is not intended to be used as the sole basis of any investment decision, nor should it be construed as advice designed to meet the investment needs of any particular investor. Past performance is not necessarily indicative of future returns.

Citations for Disclaimer

Barber, Brad M. and Odean, Terrance, Trading is Hazardous to Your Wealth: The Common Stock Investment Performance of Individual Investors. Available at SSRN: “Day Trading for a Living?”

Barber, Brad M. and Lee, Yi-Tsung and Liu, Yu-Jane and Odean, Terrance and Zhang, Ke, Learning Fast or Slow? (May 28, 2019). Forthcoming: Review of Asset Pricing Studies, Available at SSRN: “https://ssrn.com/abstract=2535636”

Chague, Fernando and De-Losso, Rodrigo and Giovannetti, Bruno, Day Trading for a Living? (June 11, 2020). Available at SSRN: “https://ssrn.com/abstract=3423101”