timothy sykes logo

Patterns To Watch

Another Obvious Spiker Following THIS Pattern

Timothy SykesAvatar
Written by Timothy Sykes
Updated 2/5/2024 6 min read

The hottest patterns in this market can repeat.

That’s how I’ve made $7.5 million in trading profits over 2 decades.

It’s how my 30+ millionaire students profit in the market too.

This isn’t rocket science. We just trade the most predictable setups.

Sure, every now and then we come across a stock that craps out. These plays aren’t 100% guaranteed …

But luckily, the patterns we use to trade always alert us if the price is about to break down.

All we have to do is follow the rules.

Case in point, I made a MASSIVE trade on Applied UV Inc. (NASDAQ: AUVI) in mid-January. It was a classic setup that built momentum all day long.

My trade details are below.

Source: Profit.ly

And last Friday, I followed the exact same pattern on Intelligent Bio Solutions Inc. (NASDAQ: INBS).

90% of traders lose in the market because they’re preoccupied with the wrong setups. On Friday, February 2 there was only one stock worth watching: INBS.

If you waste time with the wrong stocks, you’ll miss the best plays.

Here’s the #1 pattern to watch for RIGHT NOW …

Multiple Opportunities

© Millionaire Media, LLC

Technically, I traded this stock twice last Friday.

Once in the morning:

Source: Profit.ly

And once in the afternoon:

Source: Profit.ly

But the afternoon setup was the most obvious.

A lot of my students trade during Friday afternoons because they have day jobs.

It always baffles me, some people don’t understand:

You don’t need to trade all day every day.

This process can work best as a side hustle. That’s how I trade. I do best when I’m jet lagged and short on time. That’s how I refrain from over-trading.

Pay attention when you have time to trade. And don’t worry about missed plays. There’s always another trade on the horizon.

That’s how I teach my students to approach the market. And the results speak for themselves …

Judging by the strength of this 2024 market, we could see another predictable setup any day.

Let’s compare the charts of AUVI and INBS.

Burn this pattern into your memory!

2 Hot Runners

tim sykes in yosemite
© Millionaire Media, LLC

First and foremost, we’re looking for stocks that fit this framework:

  • A price below $5.
  • Recent news.
  • Spiking +20% on the day.
  • Float below 10 million.
  • Volume above 1 million.

There are a lot of stocks moving in the market every day. We can’t trade every stock that vaguely matches the same price action. Focus on the best setups.

AUVI:

  • Was trading at $2.28 before the spike.
  • Announced a new revenue opportunity.
  • Spiked 50% in premarket.
  • Had a float of 539k shares.
  • Daily volume of 70 million shares.

INBS:

  • Was trading at $2.41 before the spike.
  • Announced bullish revenue numbers.
  • Spiked 80% in premarket.
  • Had a float of 664k shares.
  • Daily volume of 95 million shares.

Both of these stocks fit the framework perfectly.

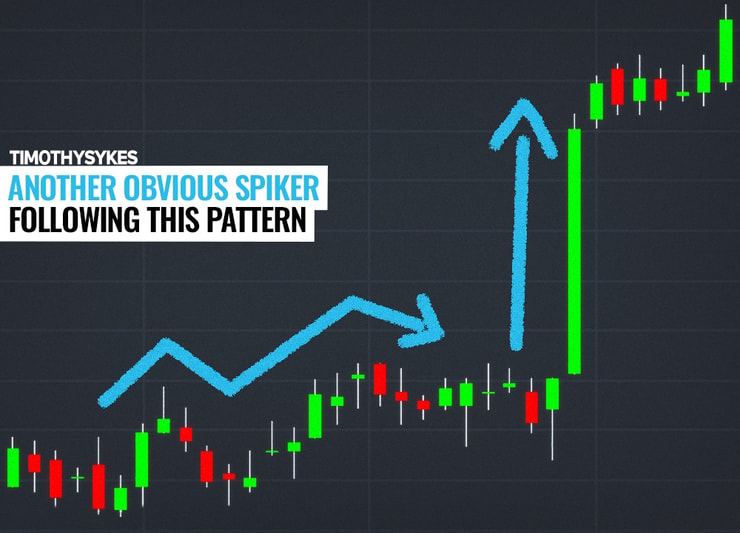
Now for the predictable price action: The stocks consolidated all day before an afternoon breakout.

The Charts

It’s pretty easy to see the similarities.

AUVI chart 1-day, 2-minute candles Source: StocksToTrade
INBS chart 1-day, 2-minute candles Source: StocksToTrade
  • The price gaps up and runs in premarket.
  • It consolidates during the middle of the day.
  • Then it pushes higher into the afternoon.

I’ll say it again: This isn’t rocket science.

However, if you trade every stock that’s consolidating you’re sure to lose.

Remember: Only a handful of spikers will fit the framework AND the price action.

Your job is to wait for the next perfect opportunity.

And make sure to keep your eyes glued to the market.

StocksToTrade alerted this play 20 minutes before the breakout:

There’s so much opportunity to profit in this market. You have no excuse to sit on the sidelines!

This 2024 momentum is still red hot. Small-account opportunities are running to the moon every week.

Take advantage of the bull-market volatility!

Cheers.


How much has this post helped you?


Leave a reply

Author card Timothy Sykes picture

Timothy Sykes

Tim Sykes is a penny stock trader and teacher who became a self-made millionaire by the age of 22 by trading $12,415 of bar mitzvah money. After becoming disenchanted with the hedge fund world, he established the Tim Sykes Trading Challenge to teach aspiring traders how to follow his trading strategies. He’s been featured in a variety of media outlets including CNN, Larry King, Steve Harvey, Forbes, Men’s Journal, and more. He’s also an active philanthropist and environmental activist, a co-founder of Karmagawa, and has donated millions of dollars to charity. Read More

* Results are not typical and will vary from person to person. Making money trading stocks takes time, dedication, and hard work. There are inherent risks involved with investing in the stock market, including the loss of your investment. Past performance in the market is not indicative of future results. Any investment is at your own risk. See Terms of Service here

The available research on day trading suggests that most active traders lose money. Fees and overtrading are major contributors to these losses.

A 2000 study called “Trading is Hazardous to Your Wealth: The Common Stock Investment Performance of Individual Investors” evaluated 66,465 U.S. households that held stocks from 1991 to 1996. The households that traded most averaged an 11.4% annual return during a period where the overall market gained 17.9%. These lower returns were attributed to overconfidence.

A 2014 paper (revised 2019) titled “Learning Fast or Slow?” analyzed the complete transaction history of the Taiwan Stock Exchange between 1992 and 2006. It looked at the ongoing performance of day traders in this sample, and found that 97% of day traders can expect to lose money from trading, and more than 90% of all day trading volume can be traced to investors who predictably lose money. Additionally, it tied the behavior of gamblers and drivers who get more speeding tickets to overtrading, and cited studies showing that legalized gambling has an inverse effect on trading volume.

A 2019 research study (revised 2020) called “Day Trading for a Living?” observed 19,646 Brazilian futures contract traders who started day trading from 2013 to 2015, and recorded two years of their trading activity. The study authors found that 97% of traders with more than 300 days actively trading lost money, and only 1.1% earned more than the Brazilian minimum wage ($16 USD per day). They hypothesized that the greater returns shown in previous studies did not differentiate between frequent day traders and those who traded rarely, and that more frequent trading activity decreases the chance of profitability.

These studies show the wide variance of the available data on day trading profitability. One thing that seems clear from the research is that most day traders lose money .

Millionaire Media 66 W Flagler St. Ste. 900 Miami, FL 33130 United States (888) 878-3621 This is for information purposes only as Millionaire Media LLC nor Timothy Sykes is registered as a securities broker-dealer or an investment adviser. No information herein is intended as securities brokerage, investment, tax, accounting or legal advice, as an offer or solicitation of an offer to sell or buy, or as an endorsement, recommendation or sponsorship of any company, security or fund. Millionaire Media LLC and Timothy Sykes cannot and does not assess, verify or guarantee the adequacy, accuracy or completeness of any information, the suitability or profitability of any particular investment, or the potential value of any investment or informational source. The reader bears responsibility for his/her own investment research and decisions, should seek the advice of a qualified securities professional before making any investment, and investigate and fully understand any and all risks before investing. Millionaire Media LLC and Timothy Sykes in no way warrants the solvency, financial condition, or investment advisability of any of the securities mentioned in communications or websites. In addition, Millionaire Media LLC and Timothy Sykes accepts no liability whatsoever for any direct or consequential loss arising from any use of this information. This information is not intended to be used as the sole basis of any investment decision, nor should it be construed as advice designed to meet the investment needs of any particular investor. Past performance is not necessarily indicative of future returns.

Citations for Disclaimer

Barber, Brad M. and Odean, Terrance, Trading is Hazardous to Your Wealth: The Common Stock Investment Performance of Individual Investors. Available at SSRN: “Day Trading for a Living?”

Barber, Brad M. and Lee, Yi-Tsung and Liu, Yu-Jane and Odean, Terrance and Zhang, Ke, Learning Fast or Slow? (May 28, 2019). Forthcoming: Review of Asset Pricing Studies, Available at SSRN: “https://ssrn.com/abstract=2535636”

Chague, Fernando and De-Losso, Rodrigo and Giovannetti, Bruno, Day Trading for a Living? (June 11, 2020). Available at SSRN: “https://ssrn.com/abstract=3423101”