timothy sykes logo

Trading Lessons

Real Support Happens at These Prices

Timothy SykesAvatar
Written by Timothy Sykes
Updated 6/7/2022 6 min read

One of the main reasons why traders can’t make money in the market is shiny object syndrome.

Their tendency to constantly chase new trends, opportunities, and ideas, causes them to have insane levels of distraction, stress, a lack of focus, and a sense of being overwhelmed.

For example, trying to figure out when the perfect time to buy or sell a stock is…

It’s a rabbit hole I’ve gone down before.

And let me tell you, it’s a complete waste of time.

Why?

Because what works in some situations won’t work in another.

So instead of trying to find definitive answers, I developed frameworks.

It’s how I’ve amassed over $7 million in career trading profits, and have helped 20+ traders achieve millionaire trader status. 

One of the frameworks I use to find areas of support and resistance is Round Numbers. 

It turns out this simple concept works for everything, whether you trade penny stocks or large caps.

And it works especially well when a stock is free-falling.

By using the Round Numbers framework I’m able to put together trades that give me a distinct edge, improve my odds of making money, and set me up for success.

I’m about to show you how it works, and how you can start implementing it to your trading right away.

The Purpose of Round Numbers

Tim Sykes checks his penny stock positions from Tulum
© Millionaire Media, LLC

When I first discovered the power of round numbers, I thought to myself … There’s no way this is real.

It just seemed so ridiculously simple that I couldn’t fathom this actually being a thing.

But the more I thought about it, the more it made sense.

After looking at my own trading, I realized that I USED round numbers all the time for entries and exits.

Retail traders often do this just because it’s easier.

And believe it or not, so do major institutions.

That doesn’t mean that just because a number is round that it will automatically provide support or resistance to a stock.

That’s where analyzing price action comes in.

One of the stock’s I recently traded, Urban One, Inc. (NASDAQ: UONE) provides a perfect example.

Applying to Urban One

I want to start off by saying that I didn’t trade this correctly. Even though I walked away with a small profit, I missed the main opportunity you’ll see below.

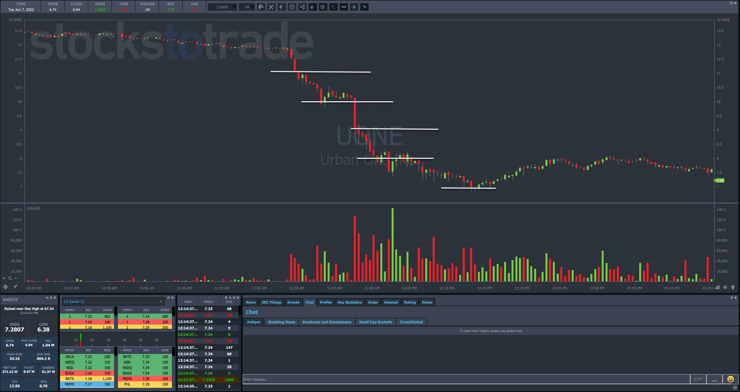
Now, just before 11:30 a.m., shares of Urban One began to plunge on heavy volume.

This sent the stock crashing through multiple levels that I want to analyze individually.

First up was $11. What I want to point out is that the stock pushed through that price pretty easily and almost got down to $10.50. Neither of the two candles after the break managed to rally back above $11. That’s how I knew $11 wasn’t a good support.

Next was $10. Here, the stock did manage to pause for a few minutes.

Now, this wasn’t the spot where I took my position, but it would have been a valid spot as price held the $10 round number. In fact, it got as high as $10.50 on a bounce. However, I would have wanted to see heavier volume to confirm this was a support level.

Next, the stock pushed through $9 without stopping. So, that wasn’t one I needed to look at.

Then, we got down to $8.

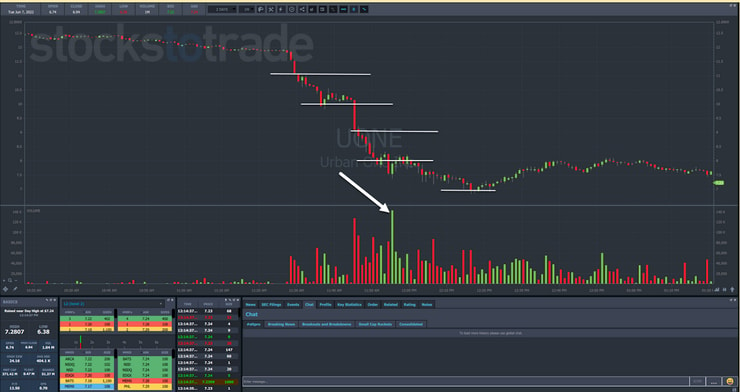
Again, you can see how the stock offered a bit of a bounce here. Yet, volume was somewhat tepid, and didn’t see that real spike until a couple of canldesticks later when price dropped down to $7.50.

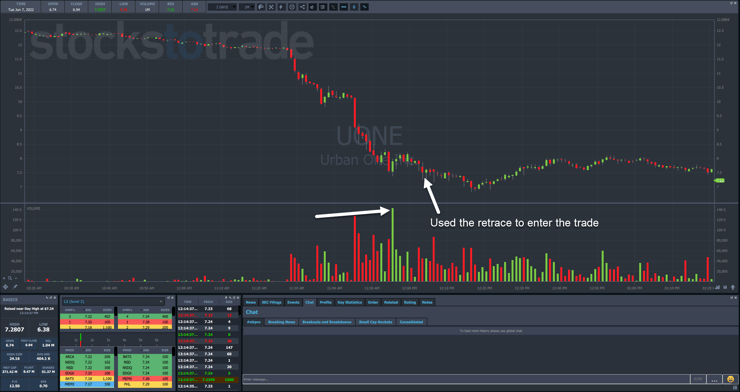
Using that as my base, I entered the stock a bit later when it retraced against that low, breaking it by a slight bit.

Now, I had expected the stock to bounce at that point. Yet, it didn’t really do much in either direction.

So, I cut it loose for a small profit.

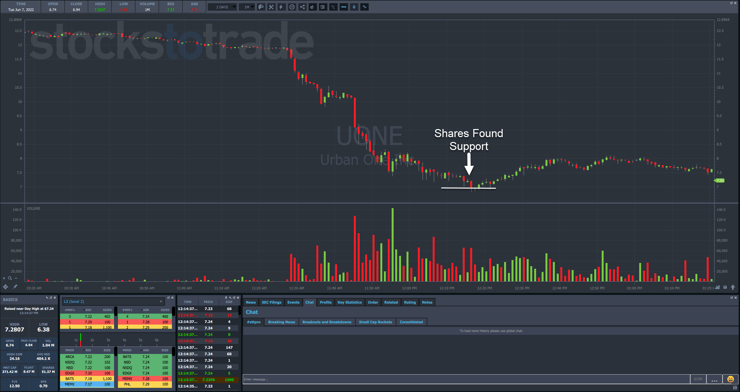
However, the important information came about 20 minutes later.

Here’s where the stock found support at $7.

Normally, I like to see a stock hit and reverse with heavy volume.

However, the fact that a stock down so much could barely break through that $7 mark says to me the selling pressure was weak.

While any heavy increase in volume could have pushed it lower, the likelihood of that happening late in the day wasn’t high.

That’s why a smarter move for me would’ve been to take the trade against $7, even if I let it bounce a bit and got in between $7.10 and $7.25.

The stock had a nice, buoyant feel that ultimately pushed it back up towards $8, another round number.

Final Thoughts

position trading the bottom line
© Millionaire Media, LLC

Take some time to look through different charts and how they react to round numbers.

The bigger and rounder the number, the better.

See if you can craft a strategy using those numbers.

Once you learn the power of these numbers, you’ll be ready to take my millionaire challenge.

—Tim


How much has this post helped you?


Leave a reply

Author card Timothy Sykes picture

Timothy Sykes

Tim Sykes is a penny stock trader and teacher who became a self-made millionaire by the age of 22 by trading $12,415 of bar mitzvah money. After becoming disenchanted with the hedge fund world, he established the Tim Sykes Trading Challenge to teach aspiring traders how to follow his trading strategies. He’s been featured in a variety of media outlets including CNN, Larry King, Steve Harvey, Forbes, Men’s Journal, and more. He’s also an active philanthropist and environmental activist, a co-founder of Karmagawa, and has donated millions of dollars to charity. Read More

* Results are not typical and will vary from person to person. Making money trading stocks takes time, dedication, and hard work. There are inherent risks involved with investing in the stock market, including the loss of your investment. Past performance in the market is not indicative of future results. Any investment is at your own risk. See Terms of Service here

The available research on day trading suggests that most active traders lose money. Fees and overtrading are major contributors to these losses.

A 2000 study called “Trading is Hazardous to Your Wealth: The Common Stock Investment Performance of Individual Investors” evaluated 66,465 U.S. households that held stocks from 1991 to 1996. The households that traded most averaged an 11.4% annual return during a period where the overall market gained 17.9%. These lower returns were attributed to overconfidence.

A 2014 paper (revised 2019) titled “Learning Fast or Slow?” analyzed the complete transaction history of the Taiwan Stock Exchange between 1992 and 2006. It looked at the ongoing performance of day traders in this sample, and found that 97% of day traders can expect to lose money from trading, and more than 90% of all day trading volume can be traced to investors who predictably lose money. Additionally, it tied the behavior of gamblers and drivers who get more speeding tickets to overtrading, and cited studies showing that legalized gambling has an inverse effect on trading volume.

A 2019 research study (revised 2020) called “Day Trading for a Living?” observed 19,646 Brazilian futures contract traders who started day trading from 2013 to 2015, and recorded two years of their trading activity. The study authors found that 97% of traders with more than 300 days actively trading lost money, and only 1.1% earned more than the Brazilian minimum wage ($16 USD per day). They hypothesized that the greater returns shown in previous studies did not differentiate between frequent day traders and those who traded rarely, and that more frequent trading activity decreases the chance of profitability.

These studies show the wide variance of the available data on day trading profitability. One thing that seems clear from the research is that most day traders lose money .

Millionaire Media 66 W Flagler St. Ste. 900 Miami, FL 33130 United States (888) 878-3621 This is for information purposes only as Millionaire Media LLC nor Timothy Sykes is registered as a securities broker-dealer or an investment adviser. No information herein is intended as securities brokerage, investment, tax, accounting or legal advice, as an offer or solicitation of an offer to sell or buy, or as an endorsement, recommendation or sponsorship of any company, security or fund. Millionaire Media LLC and Timothy Sykes cannot and does not assess, verify or guarantee the adequacy, accuracy or completeness of any information, the suitability or profitability of any particular investment, or the potential value of any investment or informational source. The reader bears responsibility for his/her own investment research and decisions, should seek the advice of a qualified securities professional before making any investment, and investigate and fully understand any and all risks before investing. Millionaire Media LLC and Timothy Sykes in no way warrants the solvency, financial condition, or investment advisability of any of the securities mentioned in communications or websites. In addition, Millionaire Media LLC and Timothy Sykes accepts no liability whatsoever for any direct or consequential loss arising from any use of this information. This information is not intended to be used as the sole basis of any investment decision, nor should it be construed as advice designed to meet the investment needs of any particular investor. Past performance is not necessarily indicative of future returns.

Citations for Disclaimer

Barber, Brad M. and Odean, Terrance, Trading is Hazardous to Your Wealth: The Common Stock Investment Performance of Individual Investors. Available at SSRN: “Day Trading for a Living?”

Barber, Brad M. and Lee, Yi-Tsung and Liu, Yu-Jane and Odean, Terrance and Zhang, Ke, Learning Fast or Slow? (May 28, 2019). Forthcoming: Review of Asset Pricing Studies, Available at SSRN: “https://ssrn.com/abstract=2535636”

Chague, Fernando and De-Losso, Rodrigo and Giovannetti, Bruno, Day Trading for a Living? (June 11, 2020). Available at SSRN: “https://ssrn.com/abstract=3423101”