Every trader needs a bread and butter setup – something they can lean on through thick and thin.
My first million came courtesy of the Supernova pattern.
I didn’t know it then, but this incredible arrangement offered a blueprint for multiple setups on the same stock.
One of the greatest skills was learning how to buy dips.
You see, most traders focus on riding breakouts, hoping to surf a multi-day wave.
I found more success buying into panic dips, especially on stocks in a multi-day bull run.
The trick was identifying WHEN and WHERE to enter the trade.
Pinpointing key reversals is more than just knowing support levels.
It’s about watching how they interact.
This is key to minimizing drawdowns and maximizing gains.
Here’s how I do it.
Table of Contents
Locate Big Gainers

Many traders make money on big, slow stocks like IBM or Goldman Sachs.
I find these stocks difficult to trade for two reasons.
First, names with large floats, anything over 50 million shares, tend to chop around, making it difficult to stick with a trade.
Second, they make smaller moves than low-float penny stocks.
That means I need to drop more money into the trade to make the same profit.
Instead, I prefer stocks with low floats that make big moves.
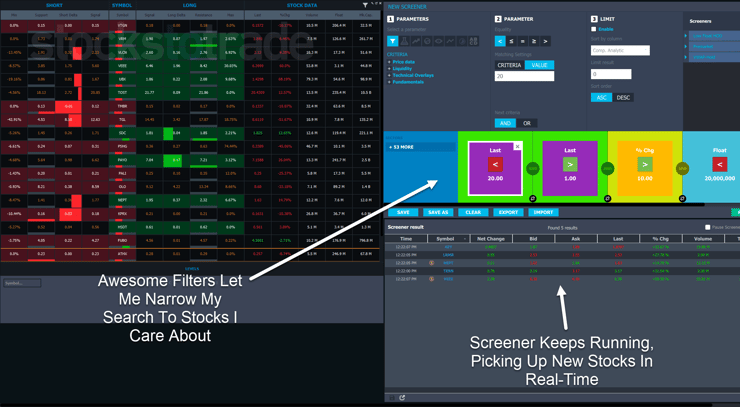
Every morning, I run a screen with our StocksToTrade platform.
While most brokers have this, StocksToTrade offers unique filters, including share float, percentage gains, and premarket volume.
But the best part is that the screener keeps running. That saves me the hassle of going back and rerunning it every few minutes.
Some of the stocks I’ve been watching recently include:
- Indonesia Energy Corp. Ltd. (AMEX: INDO)
- Intelligent Living Application Group Inc. (NASDAQ: ILAG)
- DSG Global Inc. (OTC: DSGT)
- Genesis Electronics Group Inc. (OTC:GEGI)
These are names with good volume lately and solid runs making them ideal for dip buying opportunities.
Locating Support
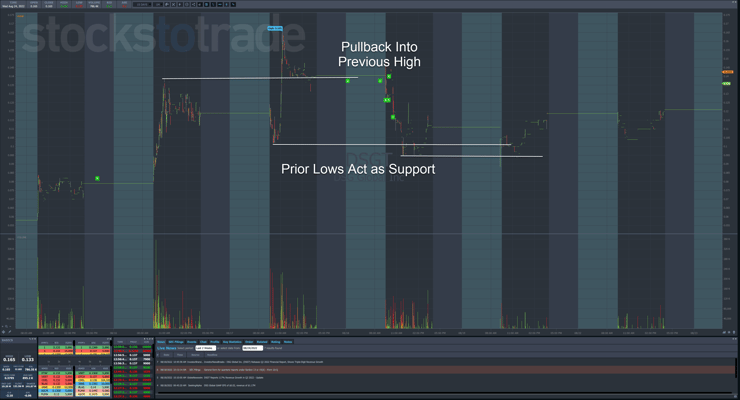
For newer traders, it’s important to locate support levels before jumping into any trade.
There are three easy ways to do this:
- Swing points
- Consolidation areas
- Open/Close
Take a look at how this plays out with DGST.
The thing to remember is that these are spots of possible support. It doesn’t mean they will stop a stock or even be reached.
More Breaking News
- Credo Technology Unveils AI Retimer Amid Strategic Partnerships
- RITR’s Strategic Moves Signal Potential Growth Amidst Market Challenges
- Red Cat Holdings Poised for Growth as Drone Orders Surge
- BigBear.ai Partners with Maqta Technologies, Enhancing AI Solutions in Port Operations
That begs the question, how do I know WHEN to jump in?
Follow the Price Action
Let’s say a stock is coming into an important support level.
What would cause it to reverse course?
Buyers, plain and simple.
I’ve found two ways to determine whether they’re stepping up to the plate.
The first is using level 2 data. This works best with OTC stocks since there are no market makers in that market.
Identifying a wall of buyers at an important support level gives me the confidence to step in at that price.
The other method is to watch price action.
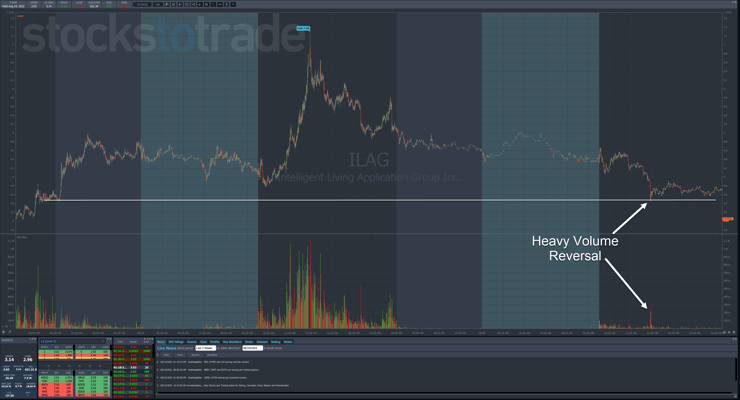
Let’s use ILAG as an example.
The support level stays around $3.50 give or take. Half dollar and whole dollar increments work great for support.
Price dropped into that support on heavy volume and then quickly reversed on equally heavy volume.
Typically, that marks a low that I can trade against, meaning use the low as a stop.
From there, I look for a bounce of 5%-10% and a quick profit.
The heavier the volume and more violent the reversal, the greater the odds that low holds.
Practice Makes Perfect

Go back through the charts of Supernovas, and you’ll see this take place repeatedly.
It isn’t always easy to locate these support levels. But with enough practice, you’ll start to pick them out.
However, this is just one part of the trading process.
I teach my millionaire students to combine news catalysts from the Breaking News Team along with chart patterns to develop some of the most incredible setups.
Don’t miss your chance to shove that 9-5 grind to the curb and start trading for real.


Leave a reply