Day trading in the stock market is a high-intensity endeavor that demands quick, informed decisions. Success in this field hinges on the adept use of various technical indicators. These tools are vital for understanding market trends, price movements, and potential trading opportunities. As a seasoned trader and educator, I have navigated the complexities of these indicators, understanding their nuances and applications in the fast-paced world of day trading.
Read this article because it offers in-depth insights into the best indicators for day trading, essential for anyone looking to navigate the complexities of the market with informed, strategic decisions.
I’ll answer the following questions:
- What is day trading?
- What are the essentials of day trading?
- What are indicators in trading?
- How do moving averages simplify market trends?
- What role does the Relative Strength Index (RSI) play in measuring market momentum?
- How does MACD identify market direction?
- What is the significance of the Stochastic Oscillator in spotting overbought and oversold conditions?
- How do Bollinger Bands assess market volatility?
Let’s get to the content!
Table of Contents
- 1 What Is Day Trading?
- 2 What Are Indicators?
- 3 Best Indicators for Day Trading
- 3.1 Moving Averages: Simplifying Market Trends
- 3.2 Relative Strength Index (RSI): Measuring Market Momentum
- 3.3 MACD (Moving Average Convergence Divergence): Identifying Market Direction
- 3.4 Stochastic Oscillator: Spotting Overbought and Oversold Conditions
- 3.5 Bollinger Bands: Assessing Market Volatility
- 4 Advanced Technical Indicators for Experienced Traders
- 5 Best Practices in Using Day Trading Indicators
- 6 Key Takeaways
- 7 Frequently Asked Questions (FAQs)
- 7.1 Which Technical Indicators Can Best Spot Overbought/Oversold Conditions?
- 7.2 Are Trading Indicators Safe?
- 7.3 What Is the Difference Between Intraday and Day Trading?
- 7.4 What Are the Key Mechanics in Day Trading?
- 7.5 How Does Market Analysis Impact Day Trading?
- 7.6 What Strategies Are Effective in Day Trading?
- 7.7 What Resources Enhance a Trader’s Knowledge and Skills?
- 7.8 How Do Market Dynamics Influence Day Trading?
- 7.9 What Are Essential Trading Operations to Understand?
- 7.10 What General Trading Concepts Should Day Traders Know?
- 7.11 How Do Shares and Returns Influence Day Trading Decisions?
- 7.12 What Role Do Products, Office Setup, and Amounts Play in Day Trading?
What Is Day Trading?

Day trading involves buying and selling securities within the same trading day. Traders in this field capitalize on short-term price movements to make profits. This type of trading requires a deep understanding of market trends, price action, and technical analysis. Day traders need to be quick on their feet, making decisions based on real-time market data and indicators.
In my years of trading, I’ve seen that successful day trading is not just about making quick decisions, but making informed ones, using a variety of technical tools and indicators to guide those decisions.
Essentials of Day Trading

The essentials of day trading revolve around understanding the market, managing risks, and making informed decisions. This requires not just an understanding of the markets and trading principles but also a mastery of technical indicators and tools.
Successful day traders analyze price movements, volume, and historical patterns to make their trading decisions. They also need to stay updated with market news and events, as these can significantly influence market movements. The key lies in synthesizing all this information and using it to predict future price movements, all within the span of a single trading day.
What Are Indicators?
Indicators in trading are statistical calculations based on the price, volume, or open interest of a security or contract. They are used by traders to forecast future price movements and make trading decisions. These indicators come in various forms, including trend indicators, momentum indicators, volume indicators, and volatility indicators. Each type provides different insights into the market, helping traders understand where the price might head next.
As someone who has utilized these indicators extensively, I can say that they are indispensable tools in a trader’s arsenal, providing critical information for day-to-day trading decisions.

Best Indicators for Day Trading
Selecting the best indicators for day trading is about finding tools that align with your trading style and objectives. In my experience, the key lies in understanding each indicator’s purpose and how it can apply to real-world market scenarios. For instance, the On-Balance Volume (OBV) is crucial for assessing buying and selling pressure. It’s not just about the lines on a chart; it’s about what these lines represent in terms of market sentiment and volume. Another essential tool is the Average Directional Index (ADX), which helps to measure the strength of a trend.
Successful day trading is not just about identifying price trends but understanding their strength and sustainability. Beginners and seasoned traders alike must consider factors like trading volume, asset prices, and the volatility represented in these indicators. Remember, it’s not just the number of indicators used, but their effective application that can lead to significant gains.
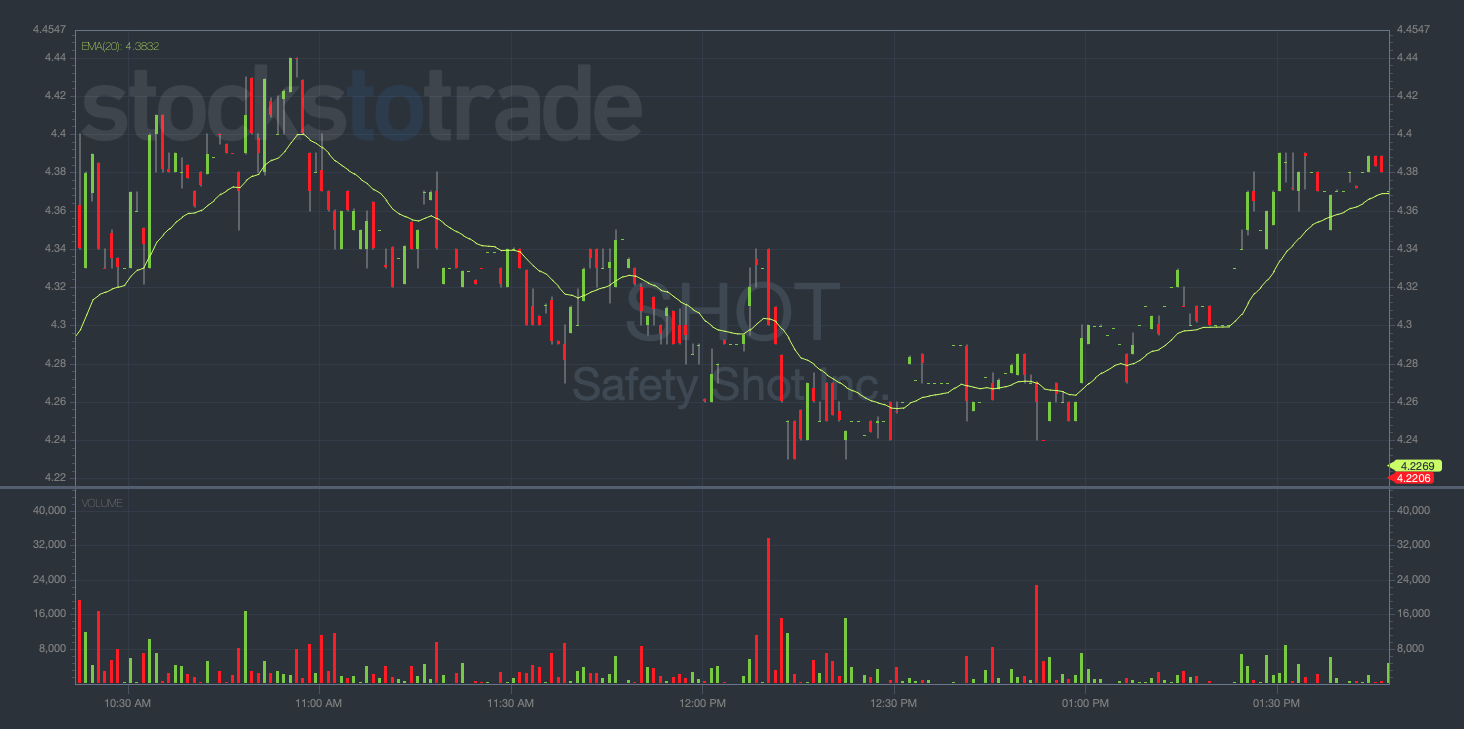
Moving Averages: Simplifying Market Trends
Moving averages are fundamental tools for day traders, used to identify the direction of the market trend. By averaging prices over a specific period, these indicators smooth out price action, making it easier to identify the overall direction of the market. Whether it’s a simple moving average (SMA) or an exponential moving average (EMA), both provide valuable insights into market trends.
It’s also crucial to delve deeper into specific strategies like moving average crosses and bounces. These techniques offer nuanced insights into market dynamics, allowing traders to spot potential entry and exit points. Moving average crosses involve observing the interactions between different moving averages, while bounces focus on price reactions to these averages. These methods can be pivotal in refining your trading strategy, providing a more detailed understanding of market movements. For an in-depth exploration of these techniques, check out my detailed guide on moving average crosses and bounces.
Relative Strength Index (RSI): Measuring Market Momentum
The Relative Strength Index (RSI) is a momentum indicator that measures the speed and change of price movements. It helps traders identify overbought or oversold conditions in the trading of an asset, signaling potential reversals. Understanding RSI levels can greatly enhance a trader’s ability to make profitable trades.
MACD (Moving Average Convergence Divergence): Identifying Market Direction
The MACD is a trend-following momentum indicator that shows the relationship between two moving averages of a security’s price. It helps traders identify potential buy and sell signals around crossovers, overbought/oversold conditions, and divergences. This indicator is a staple in my trading toolkit, providing clear signals in various market conditions.
The MACD is more than just a trend-following tool; it’s a comprehensive indicator that combines several aspects of market analysis. Understanding the intricacies of the MACD, including its components like the signal line and histogram, can significantly enhance your trading strategy. It’s a versatile tool that adapts to various market conditions, providing clear signals for both entry and exit points. For a more detailed understanding of the MACD, check out my focused article on the MACD technical indicator.
Stochastic Oscillator: Spotting Overbought and Oversold Conditions
The Stochastic Oscillator compares a particular closing price of a security to a range of its prices over a certain period. It’s used to generate overbought and oversold trading signals, identifying potential reversal points in the market. This indicator is particularly useful in volatile markets.
The Stochastic Oscillator is not just about spotting overbought and oversold conditions; it’s about timing your trades effectively. Mastering this indicator involves recognizing the subtle signals it provides in different market scenarios. It’s a powerful tool for confirming trend reversals and ensuring that you’re making informed trading decisions. To gain a comprehensive understanding of the Stochastic Oscillator and how to use it effectively in your trading, explore my complete guide to stochastic oscillators.
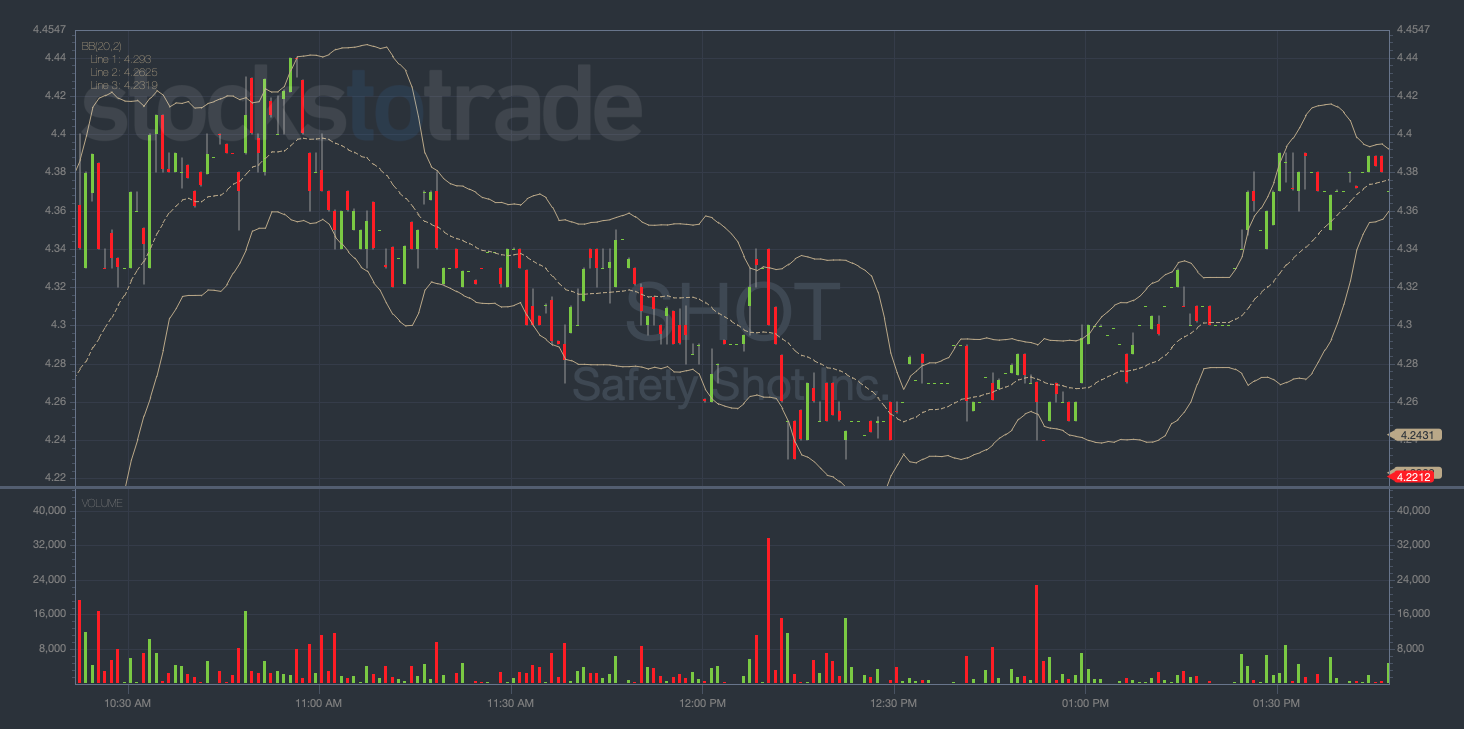
Bollinger Bands: Assessing Market Volatility
Bollinger Bands are a type of statistical chart characterizing the prices and volatility over time of a financial instrument or commodity. They help traders understand the ‘highness’ or ‘lowness’ of the price relative to previous trades. This indicator is crucial for assessing market volatility and potential breakouts.
Advanced Technical Indicators for Experienced Traders
For experienced traders, advanced technical indicators provide deeper insights into market movements and trends. Tools like the Supertrend indicator, which combines price range and volatility, can offer valuable signals, especially in a trending market. The use of Exponential Moving Average (EMA) or Volume-Weighted Average Price (VWAP) can provide more weight to recent prices, offering a nuanced view of market momentum.
In my webinars, I’ve often emphasized the importance of understanding the basis and limitations of these tools. For example, the use of momentum oscillators in a sideways market can be tricky and requires a good grasp of market context. Utilizing these advanced tools requires not just knowledge but also a sense of caution, ensuring they complement your overall trading strategy and don’t lead to overconfidence or misinterpretation of market signals.
Fibonacci Retracements: Predicting Potential Market Reversals
Fibonacci retracements are tools used to identify potential reversal levels based on the Fibonacci sequence. These indicators are particularly useful in trending markets, helping traders identify potential areas of support and resistance.
Ichimoku Kinko Hyo: A Comprehensive Market View
The Ichimoku Kinko Hyo, or Ichimoku Cloud, provides a comprehensive view of the market. It combines multiple indicators into one, offering a holistic view of support and resistance levels, momentum, and trend direction. This advanced indicator can be a powerful tool in the hands of experienced traders.

Best Practices in Using Day Trading Indicators
When using day trading indicators, it’s crucial to approach them with a strategy that aligns with your trading goals and style. As someone who has spent years in the trenches of day trading and educating others, I can attest to the importance of not just knowing your indicators but also understanding how to apply them effectively. One key practice is the correct interpretation of indicators like Moving Averages or the Average Directional Index (ADX). These tools, when read in conjunction with price trends and volume, can offer insights into potential market movements.
Incorporating indicators such as On-Balance Volume (OBV) or the Exponential Moving Average (EMA) helps in understanding the weight of the trade volume and the average price trends, respectively. It’s also vital to use these indicators to confirm the signals from other tools like candlestick patterns or trend lines, ensuring that you’re not basing decisions on a single piece of data. Remember, in the world of day trading, where asset prices can fluctuate significantly, the use of indicators should be about building a cohesive picture rather than relying on a single line of evidence.


Utilizing a demo account to practice your strategies or test new indicators can be a game-changer, especially for beginners. It allows traders to get a real-time sense of how these indicators work in live market conditions without risking real money. Also, keeping up with the latest research, articles, and updates in trading technologies and platforms is essential. As markets evolve, so do the tools and strategies successful traders use.
In my experience, one of the most valuable practices is continuous learning and adapting. Markets change, new indicators emerge, and trading platforms update their features. Staying informed and adaptable is key, and it’s something I constantly emphasize in my teaching. Whether you’re trading stocks, exchange-traded funds (ETFs), crypto, or derivatives, the right indicators, used in the right way, can significantly enhance your trading decisions and potential for success.
Combining Indicators for Enhanced Analysis
Using a combination of indicators can provide a more comprehensive view of the market. For example, combining trend indicators with momentum indicators can help validate trading signals. It’s important to use a mix of indicators that complement each other without causing information overload.
Avoiding Common Pitfalls in Indicator Usage
One common pitfall in using indicators is relying too heavily on them without considering the broader market context. It’s crucial to use indicators as tools, not crutches, and to combine them with fundamental analysis and market news. Also, avoiding the temptation to overfit indicators to past market data is key, as this can lead to misleading trading signals.
Key Takeaways

- Indicators are essential tools for day traders, helping to analyze market trends, momentum, and volatility.
- It’s important to choose the right indicators that align with your trading style and to use them as part of a broader trading strategy.
- Combining different types of indicators can provide a more rounded view of the market, but it’s crucial to avoid over-reliance on them.
Trading isn’t rocket science. It’s a skill you build and work on like any other. Trading has changed my life, and I think this way of life should be open to more people…
I’ve built my Trading Challenge to pass on the things I had to learn for myself. It’s the kind of community that I wish I had when I was starting out.
We don’t accept everyone. If you’re up for the challenge — I want to hear from you.
Apply to the Trading Challenge here.
Trading is a battlefield. The more knowledge you have, the better prepared you’ll be.
How do you use indicators in your trading strategy? Let me know in the comments — I love hearing from my readers!
Frequently Asked Questions (FAQs)
Which Technical Indicators Can Best Spot Overbought/Oversold Conditions?
The RSI indicator and Stochastic Oscillator are among the most effective indicators for identifying overbought and oversold conditions. They provide clear signals that help traders anticipate potential market reversals.
Are Trading Indicators Safe?
No trading indicator is infallible. They should be used as tools to inform trading decisions, not as guarantees. Proper risk management and a comprehensive trading strategy are essential for safe trading.
What Is the Difference Between Intraday and Day Trading?
Intraday trading involves buying and selling securities within the same trading day, similar to day trading. However, it specifically refers to a trading style where positions are not just closed by the end of the day but are actively managed throughout the day to exploit short-term market movements.
What Are the Key Mechanics in Day Trading?
In day trading, understanding cases of market movements, trading range, and identifying highs are crucial. Options trading and managing lot sizes are also fundamental mechanics. These elements help traders recognize patterns and make informed decisions.
How Does Market Analysis Impact Day Trading?
Market analysis in day trading involves assessing value through charts and understanding distribution patterns. Accumulation phases and standard deviation are key indicators, helping traders gauge market volatility and potential trend reversals.
What Strategies Are Effective in Day Trading?
Successful day trading strategies include recognizing an uptrend for timely entry, seeking confirmation signals, and identifying breakdown patterns for exit strategies. Understanding decision-making processes and interpreting signs of market movements are essential for day trading success.
What Resources Enhance a Trader’s Knowledge and Skills?
For day traders, continuous learning is key. Reading relevant trading materials, utilizing resources like expert-authored books or articles, and summarizing key takeaways can enhance expertise. An author’s experience and expertise can provide invaluable insights into day trading strategies.
How Do Market Dynamics Influence Day Trading?
Understanding market dynamics is crucial for day traders. This includes monitoring changes in market sentiment, tracking buyers and sellers’ behavior, observing price rises, and understanding investors’ psychology. The concept of “shoulders” in chart patterns is also vital for predicting future movements.
What Are Essential Trading Operations to Understand?
Day traders need to work closely with brokers, manage assets effectively, and understand different order types. Managing losses and executing transactions efficiently are also critical components of day trading operations.
What General Trading Concepts Should Day Traders Know?
Day traders should familiarize themselves with various categories of trading instruments, understand trading policies, and the importance of links between different markets. Additionally, recognizing the addition of patterns in charts and understanding time frames are essential for effective trading.
Day trading often involves buying and selling shares multiple times within a single trading session. Understanding the potential returns from these trades is crucial. Traders must consider hundreds of variables and scenarios, aiming to maximize returns while managing risk. The summary of past trades can offer insights for future strategies, giving traders an advantage in decision-making.
What Role Do Products, Office Setup, and Amounts Play in Day Trading?
The selection of trading products is essential, as different products offer varying levels of volatility and opportunity. The setup of a trader’s office, including the technological and analytical tools available, can significantly impact the amount of information processed and the efficiency of trading. Additionally, the idea of how much capital to allocate per trade (amount) is crucial, as it determines potential gains and losses. Vice versa, understanding the impact of market movements on product values is vital for day traders.

Leave a reply