When it comes to stock trading chart software, you have tons of options. Some aren’t great, while others can potentially help improve your trading skills.
StocksToTrade — a trading and charting platform I helped design — offers awesome features that can help you trade every day. Some Trading Challenge students even say it makes them feel like “masters of the universe.”
(Full disclosure: I helped develop StocksToTrade and I’m a major investor. That said, it’s my dream stock-scanning tool. It’s designed to help save time in finding the best stocks that fit my patterns and strategy.)
Speaking of masters … sign up to get an alert for my next Market Mastery. It’s your chance to see what it’s like to watch me trade live.
That said, there are other stock charting software programs traders can use. Let’s explore how to use trading charts for day trading and the benefits stock charting software can have on your trading strategies.
Table of Contents
- 1 What Is Stock Chart Software?
- 2 How Stock Charts Work
- 3 What Is the Best Stock Charting Software for Beginners?
- 4 What Do You Need To Look at Before Choosing a Stock Chart Software?
- 5 What Is the Best Stock Chart Software Available?
- 6 6 Best Free Candlestick Charting Software
- 7 How to Use Technical Chart Analysis
- 8 Trading Candlestick Chart Patterns Explained
- 9 Trading Chart Patterns Frequently Used for Day Trading
- 10 Trading Chart Patterns Frequently Used for Penny Stock Trading
- 11 Trading Challenge
- 12 Frequently Asked Questions About Trading Charts
- 13 Conclusion
What Is Stock Chart Software?
Technical analysis is a huge part of my trading. Other gurus on Profit.ly use technical analysis, as well. So, I want to share some web-based stock-charting tools.
Stock chart software allows you to generate different types of charts based on a stock’s price movements. You can also add various technical indicators — the number and type depend on the quality of the software. And many come with filters.
Free stock chart software often lets you generate charts in 1-, 3-, 5-, and 15-minute increments. These software programs draw information from just one data source, so they’re not complete. But they can help you make trades based on technical analysis.
The Importance of Learning How to Properly Read a Stock Chart

If you’re going to take a deep dive into technical analysis, I recommend finding a software-based system. These platforms often have more features than web-based alternatives.
But keep in mind that they can come with a higher price tag. So if you’re just starting out or not planning to focus on technical analysis too much, consider that in your decision.
The smartest way to learn how to read a stock chart accurately is to look at actual stock charts. Analyze, compare, and assess them. Watch the movements after the chart to see if your predictions were correct. Why does it matter?
If you don’t know how to read a stock chart, you’ll have to make trades based on guesses or emotion. I don’t recommend either one.
How Stock Charts Work
Let’s talk about how stock trading charts work for a minute.
When it comes to chart technical analysis, you’re looking at a chart with a trend line. The trend line shows how the stock’s price rises and falls over a given period of time. It’s often rendered in blue.
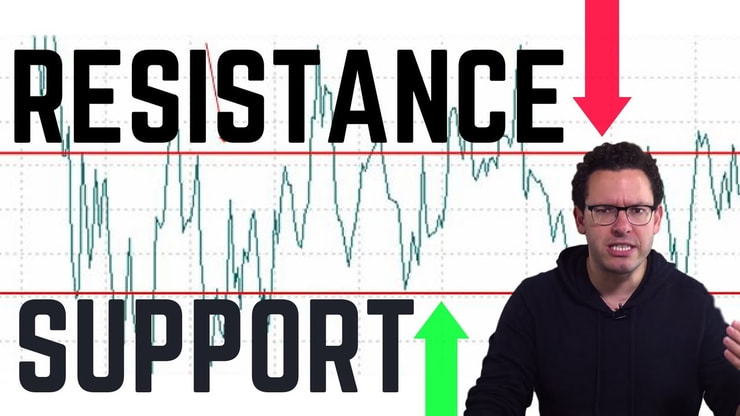
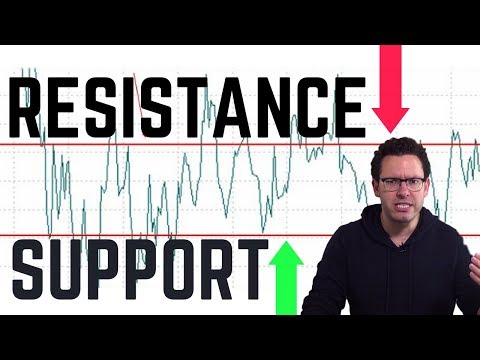
Then you have support and resistance.
These are the prices beyond which a stock is unlikely to move. Resistance is the top of the range. When a stock breaks resistance, it climbs higher than expected in price. Support sits at the bottom. The stock’s price is unlikely to fall below that line.
When a stock’s price moves outside its current levels of support and resistance, new lines are drawn. This is how traders make decisions. For instance, if you’re buying a stock, you would want to buy in at or just above the support. If you’re selling, you want to get out before it hits resistance — unless, of course, you’re anticipating a breakout.
When a stock breaks resistance, it rises above that key line and is considered a breakout. If it falls below support, it’s a breakdown. This is often when the real money gets made.
The point here is that chart technical analysis tells a stock’s story. You can look at a chart that spans 10 years or one that represents just one minute of price action. Intraday charts usually break down into far briefer periods of time. That’s because you want to buy and sell before the close of the market.
What Is the Best Stock Charting Software for Beginners?
No matter your trading experience, I recommend using StocksToTrade.
It’s a robust, comprehensive tool that provides far more than stock charting functionality. It has built-in help guidelines to assist you in learning how to use it for better trading.
What Do You Need To Look at Before Choosing a Stock Chart Software?
When choosing stock trading software, consider your budget as well as your personal preferences. And think about longevity. Will the platform you choose work for you as you evolve as a trader?
You don’t want to learn how to use stock trading software only to have to switch when you outgrow it. Some stock trading chart programs lack the nuance and granularity you need to make fast, accurate trading decisions.
Trading penny stocks, for instance, involves capitalizing on volatile stocks with large positions. If you don’t have access to fast charting where you can isolate patterns and view previous price movements, you can miss opportunities to profit.
Struggling with volatility? Check out my free Volatility Survival Guide. I created it to help you navigate and survive any crazy market.
Cleanliness
Messy trading charts drive me nuts. They’re painful to look at, any patterns are almost impossible to see. It makes my eyes tired after just a few minutes. Messy charts make it tough to suss out how a stock is performing.
Cleanliness also applies to the software program’s user interface. Can you easily navigate to the screens you need? Are there shortcuts or hot keys to help you work faster? Are the fonts easy to read?
Usability
You also need to consider how easy a platform is to use. Does the software allow you to adjust technical indicator parameters? Can you choose from multiple stock types? What about watching multiple securities simultaneously.
Every trader is different. Features I look for in a stock trading chart software program might be completely different from what you want. Make a list of the features you absolutely need the software to have, as well as a list of potential bonus features.
It’s kind of like buying a house. You walk in with your wish list and check off each item. If there are bonuses, you’re more likely to buy.
What Is the Best Stock Chart Software Available?

If you want to learn how to read candlesticks and other chart patterns, consider signing up for StocksToTrade. It’s a highly adaptive trading tool that goes far beyond stock charting software. You can use it to paper trade, develop your trading style, and more.
You can also add on hot features, like the Breaking News chat and Oracle Alerts. Both can help you find hot trades.
6 Best Free Candlestick Charting Software
If you’ve been following me for any length of time, you know how much I like candlestick charts. They’re easy to read and provide lots of nuance for eagle-eyed day traders.
Those of you who like candlestick charts might like these free charting software options. They all have limitations, but they can be great for beginners on a budget. Let’s take a look at some free chart websites.
1. TradingView
I’m a fan of TradingView because it’s practically made for day traders. You can view between one- and 15-minute time frames.
It has a thriving social media component, though not as active as Profit.ly. And the software allows you to set up alerts. You can also view multiple charts on the same screen for comparison.
Like most stock chart programs, TradingView goes by a freemium model. You can upgrade if you want access to more in-depth features.

2. StockCharts.com
You can create candlestick charts at StockCharts.com, as well as line and bar charts. The software offers up to three years of data if you have a free account. Upgrading to a paid account gives you access to more data.
In terms of user experience and aesthetics, it’s pretty plain. But it’s functional and can be a good choice if you’re on a budget.
The downside is that you must upgrade to a paid plan if you want to use intraday charts.
3. Yahoo! Finance
Yahoo! Finance is also on the simple side in terms of features and aesthetics. You can filter charts based on several technical indicators, which can be handy. You can view stock movements over up to five years in duration and view several comparison charts at the same time.
4. Google Finance
I don’t think Google’s charting software comes close to StocksToTrade. But Google Finance might be a good fit for you if you’re a beginner. And if you use Google’s suite of tools, you might find their interface easier to navigate.
5. BigCharts.com
BigCharts.com has been around for a long time. It allows you to use lots of technical indicators as well as several different chart types.
Unlike many other sites, intraday charts are available between one and 60 minutes, giving you far more flexibility when assessing price action. Also, the company offers data all the way back to the mid-1970s. You can find plenty of historical information on long-term companies.
6. FreeStockCharts.com
It’s important to understand what “real time” means when it comes to stock charting software like FreeStockCharts.com. If the data is less than 15 minutes old, you’re looking at BATS data, which means that it’s coming from one source and doesn’t represent all exchange data.
However, this site can still be a handy feature. FreeStockCharts.com offers intraday charts as well as weekly, monthly, and yearly options. You can filter your data by up to 80 technical indicators, and you can save your favorite chart layouts as long as you have an account and you’re signed in.
How to Use Technical Chart Analysis

Technical chart analysis boils down to supply and demand. When supply goes up, demand decreases, and vice versa.
A stock’s price is represented in chart format based on fluctuations. You’ll see the trend line as well as support and resistance levels. Identifying patterns in a stock’s price based on historical performance is a good way to start reading and analyzing charts.
You’re not just looking at price, though. You also have to consider volume. When volume increases, you have more opportunities to make money, either by purchasing stock or shorting it.
With fundamental analysis, valuation matters more than anything else. However, if you’re conducting technical chart analysis, valuation doesn’t matter. What matters is the stock’s trends. You can potentially make money regardless of a company’s or stock’s valuation — even if the stock only costs a few dollars and sells for just a dollar or so more.
How to Read Trading Charts
As mentioned, I prefer candlestick charts to any other stock chart. They’re easy to read and highly intuitive.
As its name suggests, the candlestick pattern resembles a series of candlesticks. Some have wicks — upward shadows — while others have tails. Those with tails look like upside-down candlesticks.
The candlestick itself is called the body. It’s either hollow or filled. If it’s hollow, there’s buying pressure. And a filled candlestick represents selling pressure.
The top of the wick is the high for the stock value at that particular time and the bottom of the tail is the low. The point at which the wick or tail meets the candlestick denotes the open and close prices for the stock.
Trading Candlestick Chart Patterns Explained
To help you learn to read trading charts, let’s go over the most popular chart patterns. The best chart time frame for day trading is the 1-minute or 5-minute chart. But I use other time frames as well. These patterns can appear on any chart time frame.
Pennants
A pennant is also known as a symmetrical triangle or a flag. It begins with a wide range, then it consolidates tighter to a small range. Your entry is either going long when it breaks out or going short when it breaks down out of the consolidation.
Flags
A flag is similar to a pennant but the consolidation area can look more like a channel than a triangle. Your entries will be based on the same idea as the pennant. A flag is a continuation pattern, meaning it’s usually an area of consolidation before continuing in the direction of the trend before the flag formed.
Wedges
A wedge is a pattern created by price movements consolidated tighter and creating a triangle. It’s known as a reversal pattern because the trend will usually change at the convergence of the triangle. A falling wedge is a bullish pattern and a rising wedge is a bearish pattern.
Triangles
A triangle pattern is a continuation pattern. These are known as a descending triangle or an ascending triangle. An ascending triangle has a flat top along the highs and an angled trendline along the higher lows. It’s a continuation pattern of an uptrend.
A descending triangle is the opposite and has a flat bottom with lower highs forming an angled top downwards. A symmetrical triangle is similar to a pennant and could break out of the triangle either up or down.
Cup and Handles
A cup and handle is a U-shaped pattern followed by a slight downward move, creating the handle. The move then continues upwards. The pattern is known as a bullish pattern.
Head and Shoulders
The head and shoulders pattern forms when an uptrend makes a high, then a slight retracement, then continues to make a higher high. It then drops again, to the same level as the previous dip, and bounces but makes a lower high. When it breaks below the level that held both dips, it usually continues lower.
Double Top
A double top is formed when a high is made, followed by a small retracement and then a retest of the previous high. If the stock can’t break through the previous high, it forms a double top. This is known as a reversal pattern and the stock price will usually go down after it fails to break the high.
Gaps
A gap is a chart pattern where the stock price increases or decreases from the previous days close. This creates a gap in the chart between the two daily candles. A gap can be a move up or down and can change direction within the trading day — meaning a gap up doesn’t always mean the stock will continue upwards.
Reversal Patterns
A reversal pattern is a pattern that indicates that an ongoing trend is about to change directions. I’ve gone over a few above, like the double top (or double bottom being the opposite), head and shoulders, and the rising of falling wedges.
Trading Chart Patterns Frequently Used for Day Trading
I go over the trading chart patterns listed above in my most comprehensive DVD “How to Make Millions” (all proceeds go to charity). In the DVD I also cover catalysts and how they can affect volume and price.
Day traders use any number of patterns to day trade. You can combine trading chart patterns with candlestick patterns … and the possibilities can seem endless. This is why I push students to study. There are so many options, you need to find which patterns make sense to you so you can find your edge.
Trading Chart Patterns Frequently Used for Penny Stock Trading
When it comes to trading penny stocks, I like to keep it simple. The number-one pattern I look for is gap ups.
I’m always looking for big percent gainers, preferably with a catalyst. That doesn’t mean I always trade them. As I said earlier, a gap up doesn’t mean the move will continue throughout the day.
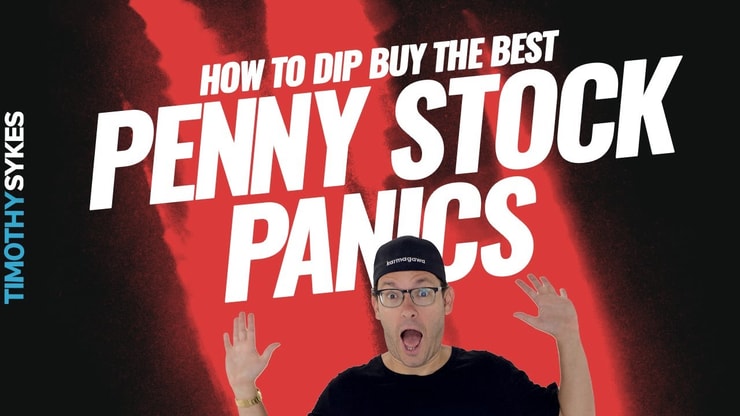
My other favorite pattern is the morning panic dip buys. I have nearly 700 video lessons on buying panics on Profit.ly. Join Pennystocking Silver for access.
Trading Challenge
I also recommend applying for my Trading Challenge. My top students have made three-, four-, five-, six-, and even seven-figure profits over their trading careers based on what they’ve learned through the Challenge.*
Ultimately, I’d love to help more people become millionaires. My overall goal, though, is to help people reach their goals. Many of my Challenge students are the same — they’re willing to share their experiences, whether it’s in my chat room or by giving live webinars.*
Frequently Asked Questions About Trading Charts
What Are Trading Charts?
Trading charts are a visual depiction of the trades made on a stock. The buying and selling of the security create the candlesticks and the charts on multiple time frames.
Which Chart Is Best for Trading?
A chart with candlesticks is the best chart for trading. Candlesticks show the most information on the trades made. I look at charts with multiple timeframes, such as the daily, 1-minute, and 5-minute candlesticks.
How do You Trade with Charts?
Trading based on charts involves technical analysis. Analyzing where the stock price might go based on the previous price and movements of the stock.
What Trading Charts Do Day Traders Use?
Day traders use charts with candlesticks. Since day traders trade on intraday moves, they’re usually trading on charts with a 1-minute timeframe.
Conclusion
If you’re serious about becoming a trader, you need to understand how trading charts work. These websites for free stock trading charts can help you learn how to read charts accurately and use the data to make smarter plays.
I spend a lot of time reading charts, especially since I focus on penny stocks. There isn’t always much — if any — fundamental information out there. So I have to rely on volume, price movements, and patterns to know when to make my next move.
I urge you to continue your education in reading charts and to spend at least an hour or so — or more — every day studying chart patterns.
Do you use a free stock trading chart software for your trading? Let me know in the comments … I love to hear from my readers!

Leave a reply