Do you know how to use the different stock indexes? The Dow, NASDAQ and S&P 500 indexes are 3 of the best measurements of trading activity and give investors a clear picture of the overall health of the economy. Each represents a different type of index, calculated and tracked in their own way, reporting real time movements of stock price and market capitalization.
I created this infographic to demonstrate the unique features of these indexes and how they can help you along in investing.
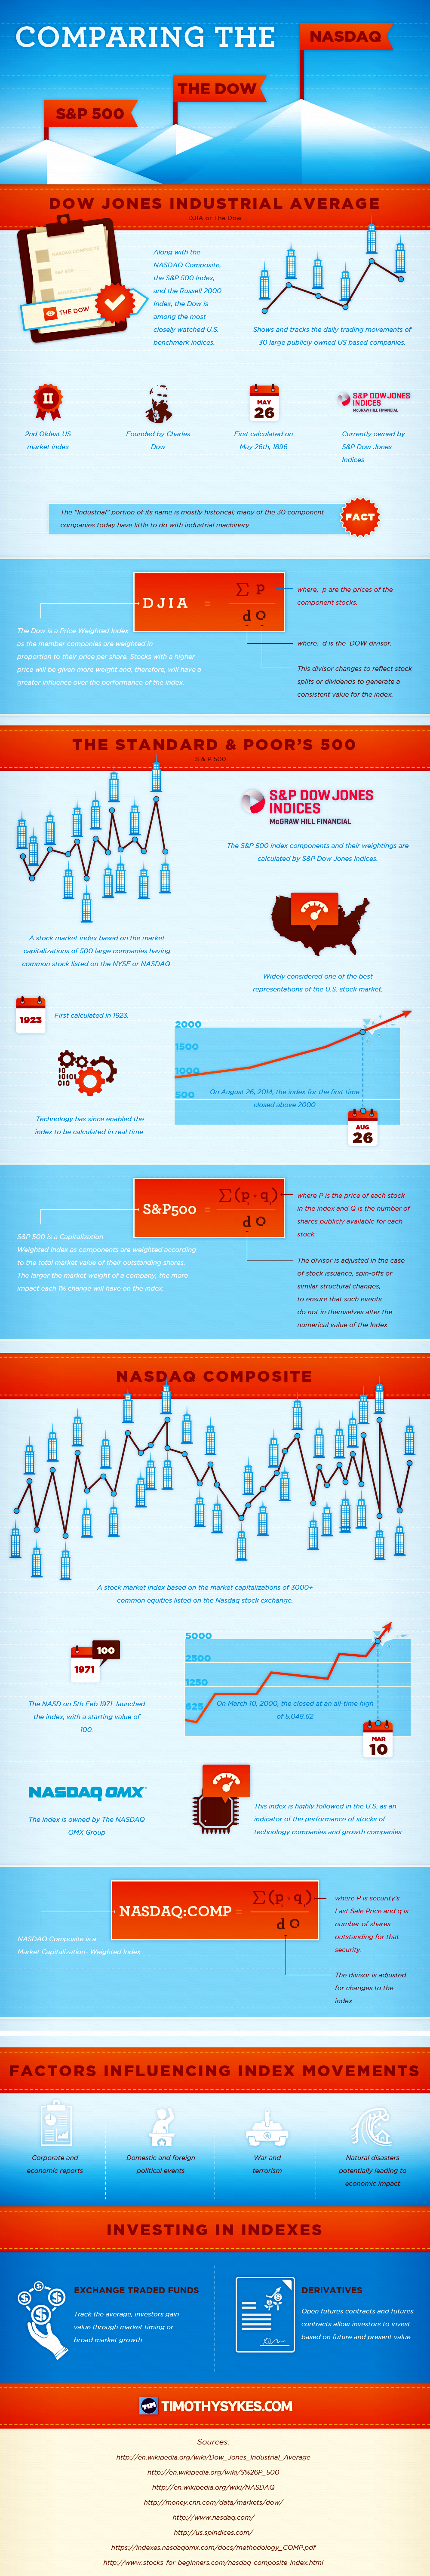
Click the image below to view
Conclusion
Stock indexes are the main tool for investors assessing the right time to invest. They provide an immensely consolidated look at the activity of many stocks that indicate the health of the overall market and industry. Through exchange traded funds and options, there are also options to invest through such indexes. Getting familiar with the Dow, NASDAQ and S&P 500 indexes and what they can tell us about the market is a great step in building your knowledge as an investor. These tools will continue to be a major part of your arsenal throughout your investing career.

Leave a reply