timothy sykes logo

Trading Tips-Tim Sykes Penny Stock

3 Ways To Make Your Trades Easier

Timothy SykesAvatar
Written by Timothy Sykes
Updated 9/4/2022 6 min read

I used to think I wasn’t smart enough to trade on Wall Street.

Even though I excelled in school, I had this idea in my head that hedge funds were run by MENSA billionaires.

After a few years of trading one of the most basic patterns out there, it dawned on me…

Anyone can become a successful trader.

Just look at the diversity amongst my millionaire students.

The problem most traders face isn’t a lack of information but TOO MUCH information.

With thousands of indicators and strategies, it’s easy to get lost in the noise.

Rather than struggle against the current, I developed three simple ways to make trading easier.

These techniques narrow your focus to higher-quality setups that produce better results and are easier to manage.


1. Avoid Choppy Stocks

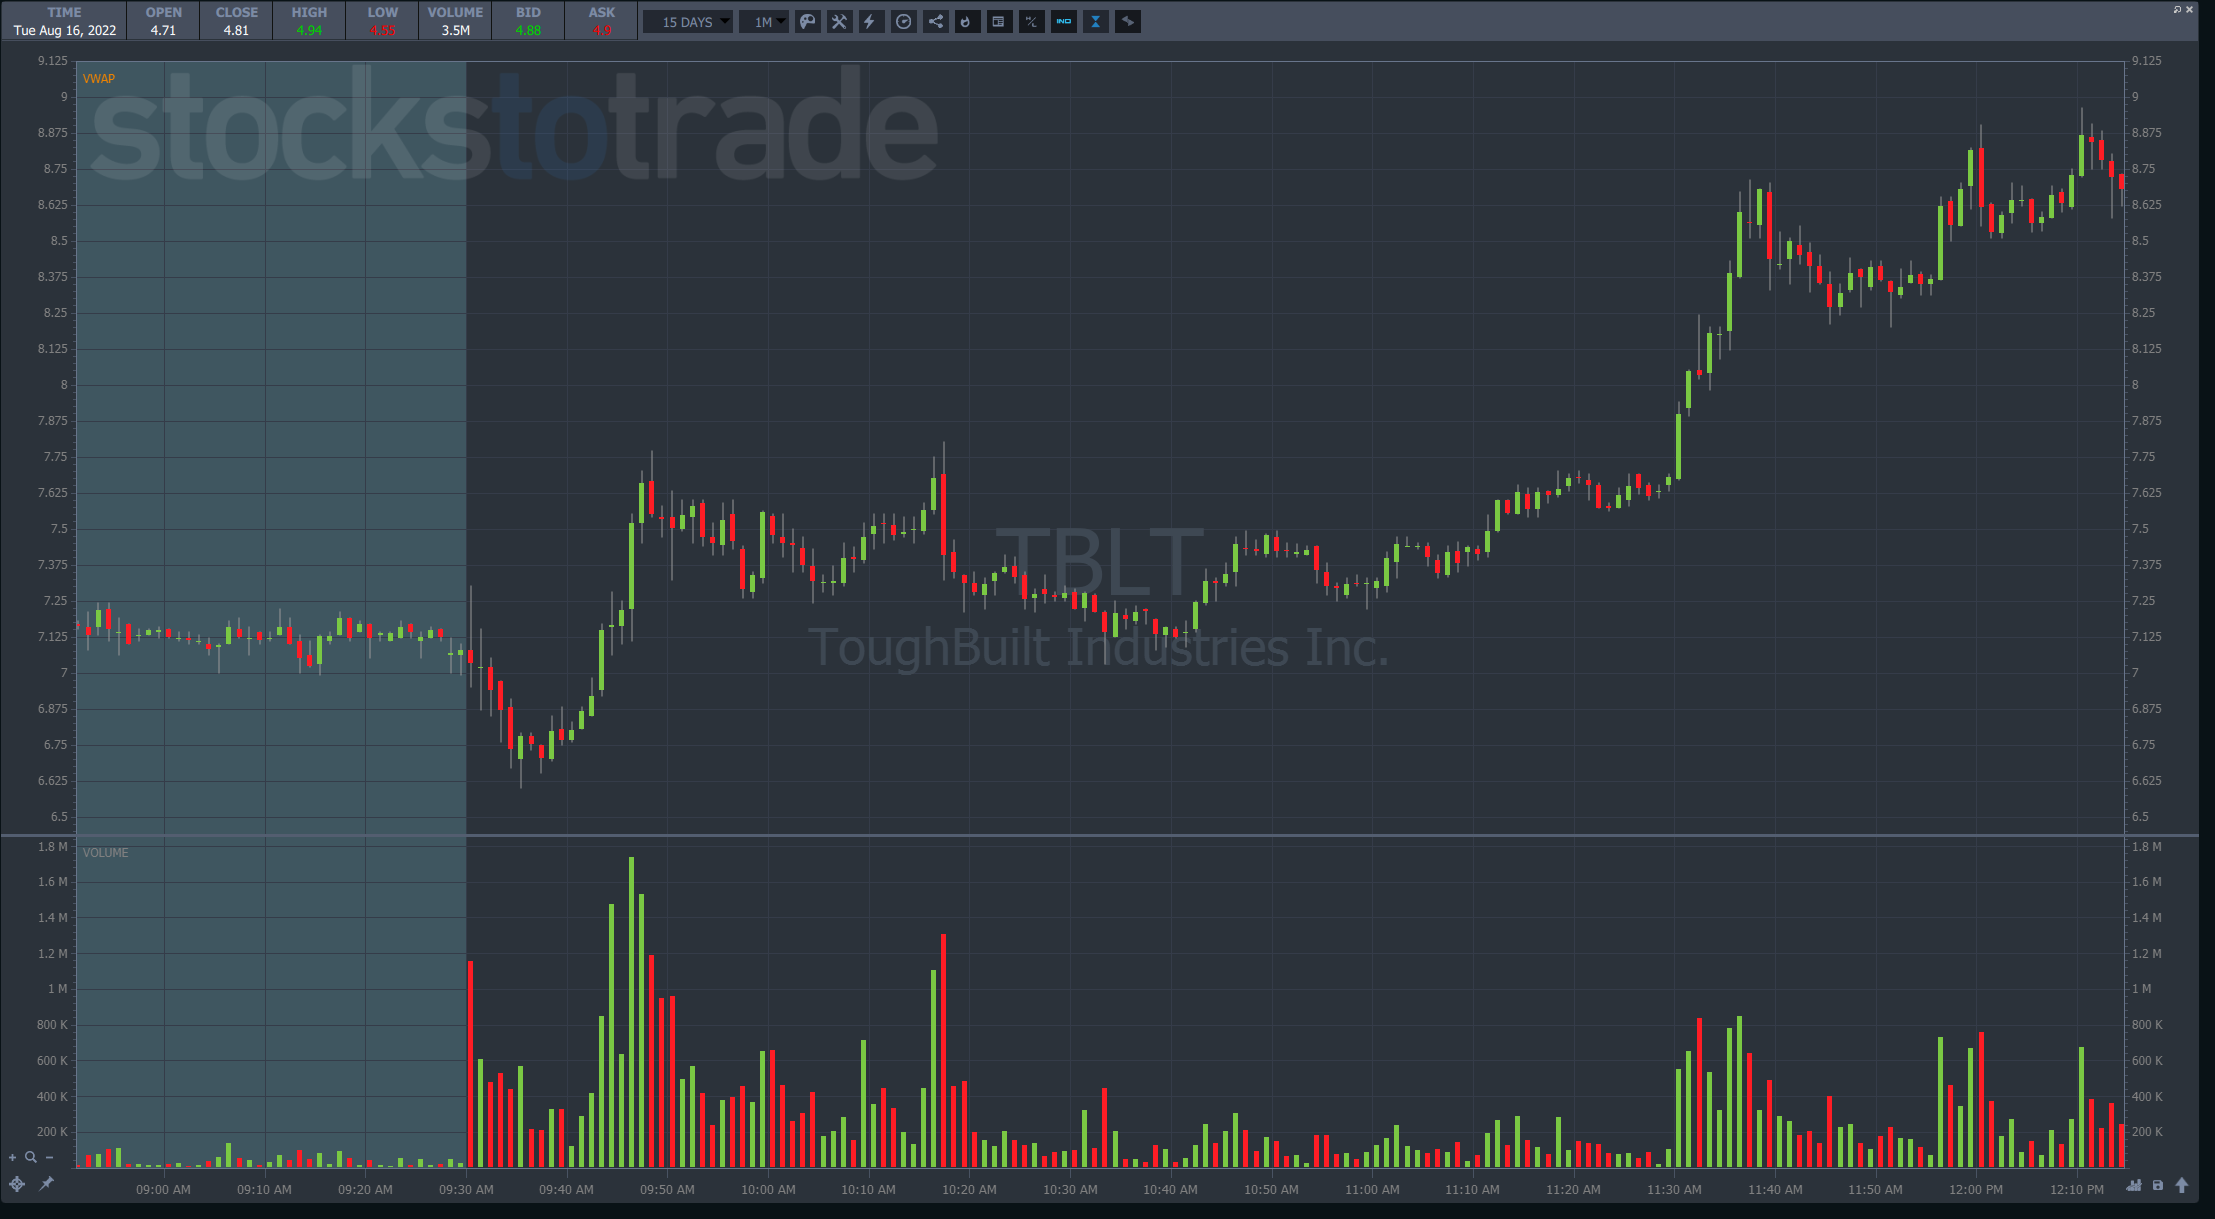
I want to show you two bullish charts. You tell me which is easier to trade from the long side.

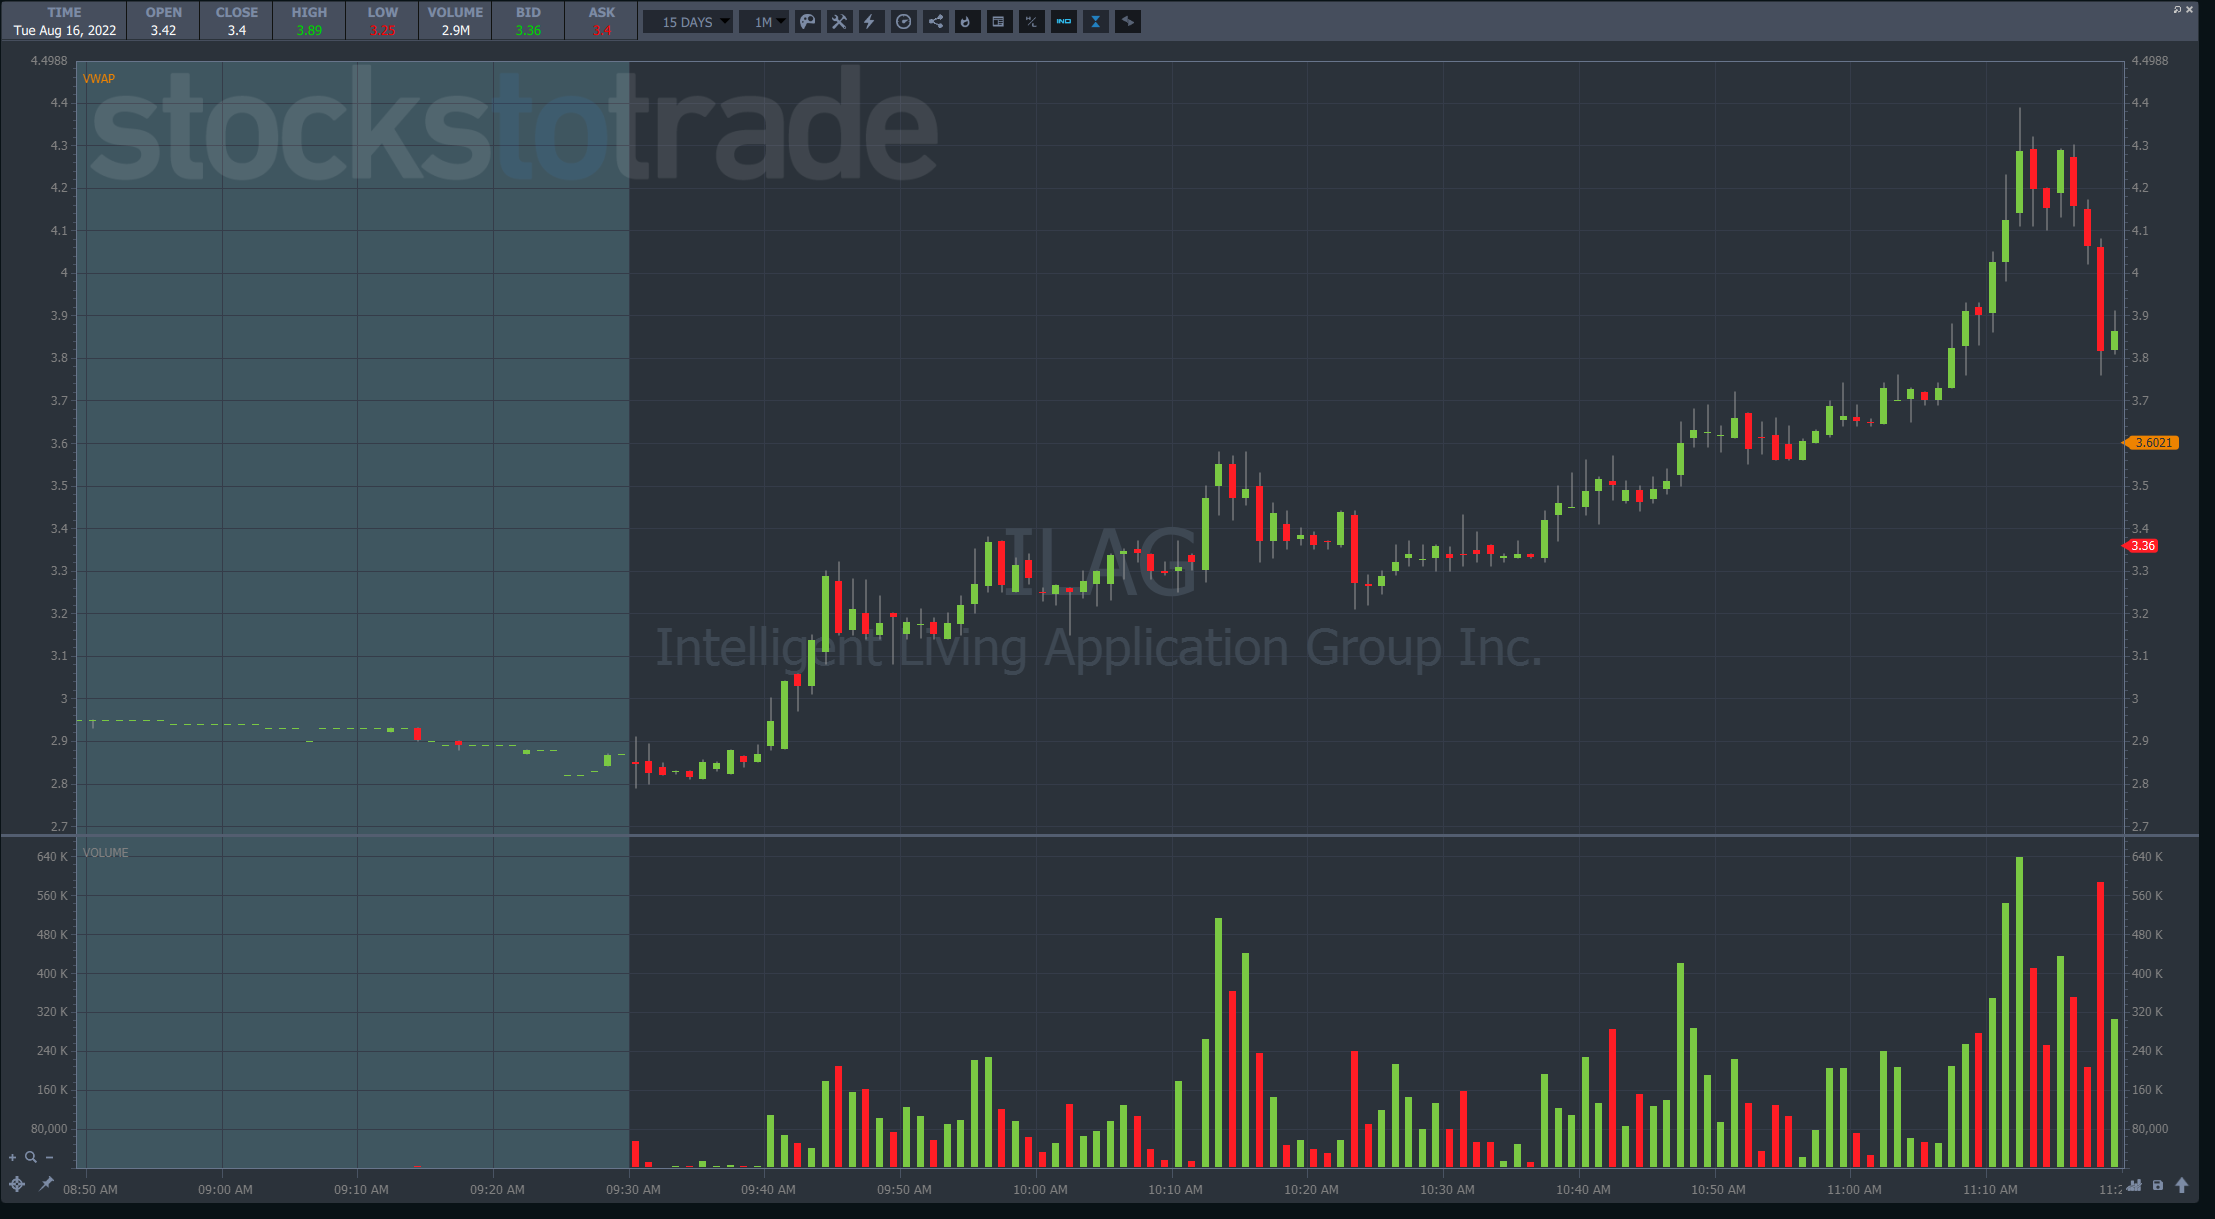
To me, the first chart is much easier to trade to buy and hold than the second.

In the first chart, price moves up in a steady, smooth trend with small pullbacks along the way.

In the second chart, shares drop initially, pop hard, chop around before dropping down, and ultimately run into the breakout.

Rather than thinking about which stock will run the furthest, ask yourself which stock is most likely to provide the smoothest ride higher.

That might seem counterintuitive, considering I prefer to buy dips.

However, both of these stocks pulled back along the way.

The difference is the second chart was much choppier.

Chop is the #1 enemy of a trader trying to squeeze out gains from their trade.

I can’t tell you how many times I’ve been tossed out of a potentially huge trade early because of chop.

The way I avoid this is by selecting stocks with lower floats.

Generally speaking, I’ve found that stocks with high floats tend to chop around more and not provide as large of spikes.

On the other hand, low float stocks can bounce hard, giving me a better reward for the risk I take.

And when they decide to run, they tend to do it in a straight line than zig-zag.

The other benefit of cleaner charts is they make it easier to define your stops and profit targets.

Choppy price action makes it difficult to determine which support level is the right one.

Smoother charts give you fewer choices, making this process much simpler.

2. Structure Your Execution

© Millionaire Media, LLC

I would say that most of my trades have one entry and one exit.

This isn’t necessarily the best way to trade, but it’s the way that works best for me.

The fewer entries and exits you have, the easier it is to manage your trades.

If you want to scale in and out of trades, it’s best to devise a standard approach.

For example, a trader could set up the following execution strategy:

  • Entries
    • Buy 50% of the position at the main entry
    • Add the other 50% halfway between the main entry and the stop
  • Exits
    • Sell 50% of the position at the 1st profit target while setting a stop on the remainder back at breakeven.
    • Sell another 50% at the next profit target and set a stop back at the first profit target for the remainder.
    • Repeat until you are out of the position.

The method you choose for entries and exits depends entirely on your style and risk tolerance.

Some traders, like myself, do one entry and one exit.

Others prefer to scale.

Whichever you pick, lay out simple rules to follow no matter what.

3. Wait for Confirmation

the bottom line outstanding shares
© Millionaire Media, LLC

Traders are an impatient bunch. We want to be in THAT trade when we see a stock moving.

Learning how to dip buy takes patience and practice.

In the meantime, you can use candlestick signals to confirm a bottom before stepping into a trade.

The downside is you may not get as good of an entry. However, it also avoids entering a trade at the wrong spot.

And for newer traders, that’s a bigger concern than getting the entry down to the penny.

Let me give you an example.

In the chart below, I highlighted the bottom where we might want to dip buy.

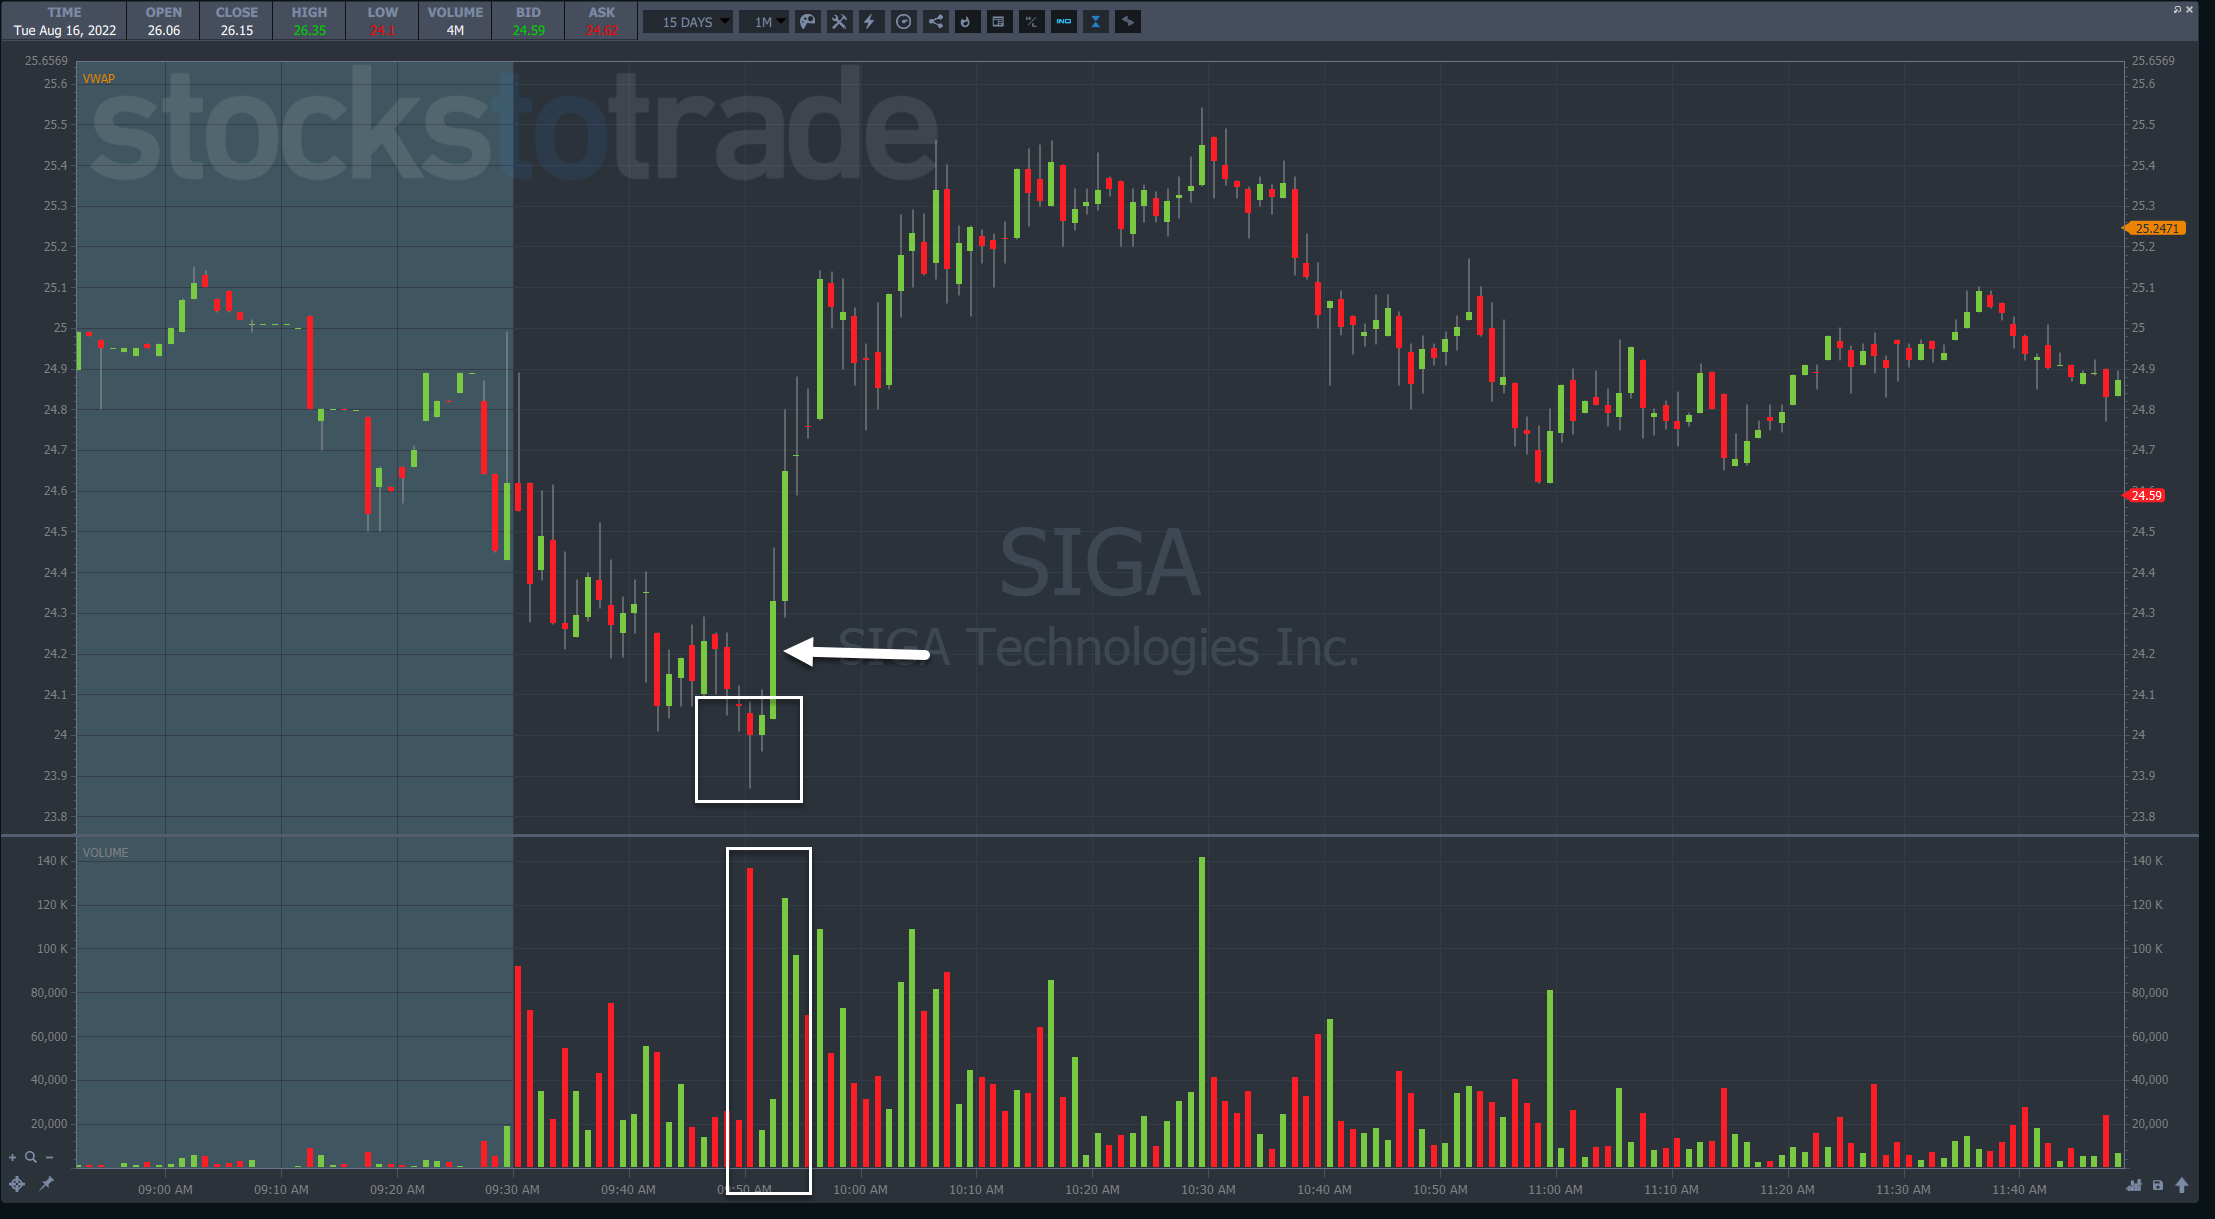
The first thing I want you to notice is the red candlestick with a long tail on heavy volume.

That’s a typical sign of a reversal.

However, say a newer trader wanted a bit more confirmation.

They could wait until the close of that big green candle the arrow points to, which came with heavy volume.

Although that would put the entry much higher than the low, it still provides plenty of upside potential.

As a trader gets more comfortable with dip buys, they can go reduce the number of confirmation signals they look for.

Final Thoughts

All it takes is one pattern to change everything. Start small and simple. Get really good at just one thing. Once you can turn a profit, then you expand into adjacent strategies.


–Tim


How much has this post helped you?


Leave a reply


Author card Timothy Sykes picture

Timothy Sykes

Tim Sykes is a penny stock trader and teacher who became a self-made millionaire by the age of 22 by trading $12,415 of bar mitzvah money. After becoming disenchanted with the hedge fund world, he established the Tim Sykes Trading Challenge to teach aspiring traders how to follow his trading strategies. He’s been featured in a variety of media outlets including CNN, Larry King, Steve Harvey, Forbes, Men’s Journal, and more. He’s also an active philanthropist and environmental activist, a co-founder of Karmagawa, and has donated millions of dollars to charity. Read More

Post image

Get my weekly watchlist, free

Sign up to jump start your trading education!

* Results are not typical and will vary from person to person. Making money trading stocks takes time, dedication, and hard work. There are inherent risks involved with investing in the stock market, including the loss of your investment. Past performance in the market is not indicative of future results. Any investment is at your own risk. See Terms of Service here

The available research on day trading suggests that most active traders lose money. Fees and overtrading are major contributors to these losses.

A 2000 study called “Trading is Hazardous to Your Wealth: The Common Stock Investment Performance of Individual Investors” evaluated 66,465 U.S. households that held stocks from 1991 to 1996. The households that traded most averaged an 11.4% annual return during a period where the overall market gained 17.9%. These lower returns were attributed to overconfidence.

A 2014 paper (revised 2019) titled “Learning Fast or Slow?” analyzed the complete transaction history of the Taiwan Stock Exchange between 1992 and 2006. It looked at the ongoing performance of day traders in this sample, and found that 97% of day traders can expect to lose money from trading, and more than 90% of all day trading volume can be traced to investors who predictably lose money. Additionally, it tied the behavior of gamblers and drivers who get more speeding tickets to overtrading, and cited studies showing that legalized gambling has an inverse effect on trading volume.

A 2019 research study (revised 2020) called “Day Trading for a Living?” observed 19,646 Brazilian futures contract traders who started day trading from 2013 to 2015, and recorded two years of their trading activity. The study authors found that 97% of traders with more than 300 days actively trading lost money, and only 1.1% earned more than the Brazilian minimum wage ($16 USD per day). They hypothesized that the greater returns shown in previous studies did not differentiate between frequent day traders and those who traded rarely, and that more frequent trading activity decreases the chance of profitability.

These studies show the wide variance of the available data on day trading profitability. One thing that seems clear from the research is that most day traders lose money .

Millionaire Media 66 W Flagler St. Ste. 900 Miami, FL 33130 United States (888) 878-3621 This is for information purposes only as Millionaire Media LLC nor Timothy Sykes is registered as a securities broker-dealer or an investment adviser. No information herein is intended as securities brokerage, investment, tax, accounting or legal advice, as an offer or solicitation of an offer to sell or buy, or as an endorsement, recommendation or sponsorship of any company, security or fund. Millionaire Media LLC and Timothy Sykes cannot and does not assess, verify or guarantee the adequacy, accuracy or completeness of any information, the suitability or profitability of any particular investment, or the potential value of any investment or informational source. The reader bears responsibility for his/her own investment research and decisions, should seek the advice of a qualified securities professional before making any investment, and investigate and fully understand any and all risks before investing. Millionaire Media LLC and Timothy Sykes in no way warrants the solvency, financial condition, or investment advisability of any of the securities mentioned in communications or websites. In addition, Millionaire Media LLC and Timothy Sykes accepts no liability whatsoever for any direct or consequential loss arising from any use of this information. This information is not intended to be used as the sole basis of any investment decision, nor should it be construed as advice designed to meet the investment needs of any particular investor. Past performance is not necessarily indicative of future returns.

Citations for Disclaimer

Barber, Brad M. and Odean, Terrance, Trading is Hazardous to Your Wealth: The Common Stock Investment Performance of Individual Investors. Available at SSRN: “Day Trading for a Living?”

Barber, Brad M. and Lee, Yi-Tsung and Liu, Yu-Jane and Odean, Terrance and Zhang, Ke, Learning Fast or Slow? (May 28, 2019). Forthcoming: Review of Asset Pricing Studies, Available at SSRN: “https://ssrn.com/abstract=2535636”

Chague, Fernando and De-Losso, Rodrigo and Giovannetti, Bruno, Day Trading for a Living? (June 11, 2020). Available at SSRN: “https://ssrn.com/abstract=3423101”