

Future FinTech Group Inc. stocks have been trading up by 15.28 percent amid upbeat sentiment on its latest strategic developments.
Key Takeaways
- FTFT has ripped from $0.55 to near $3 in weeks, showing classic low-float momentum action that active traders hunt.
- Recent FTFT intraday trading shows wide swings between $2.50 and $3.40, signaling aggressive day-trading interest and low liquidity.
- Future FinTech Group Inc. reports thin revenue and steep losses, but carries low debt and solid working capital, giving it room to maneuver.
- Valuation metrics on FTFT look distorted, with an ultra-low P/E and weak cash flow, reinforcing its status as a high-risk trading vehicle.

Live Update At 09:18:47 EDT: On Monday, September 14, 2026 Future FinTech Group Inc. stock [NASDAQ: FTFT] is trending up by 15.28%! Discover the key drivers behind this movement as well as our expert analysis in the detailed breakdown below.
Quick Financial Overview
Future FinTech Group Inc. is not a slow, steady compounder. FTFT is a speculative, story-driven name with financials that look rough on the surface and volatile on the tape. Revenue over the latest period sits around $3.3M, while FTFT booked a net loss of roughly $1.93M. That means the core business is burning cash, not generating it. Operating cash flow for FTFT came in around -$1.68M, confirming that the company’s operations are still in the red.
Yet the balance sheet tells a different part of the story. FTFT shows total assets of about $52.9M against total liabilities of only $8.5M, with current assets far outweighing current liabilities. A current ratio near 6.7 and very low debt-to-equity suggest Future FinTech Group Inc. is not drowning in leverage. Traders like that cushion, because it reduces immediate bankruptcy risk while the stock is moving.
More Breaking News
At the same time, FTFT’s profitability ratios are ugly. Negative returns on assets and equity point to an unproven business model. For traders, that combination—weak fundamentals, decent balance sheet, and a thin float—is classic fuel for sharp swings rather than steady growth.
Why Traders Are Watching FTFT Price Action
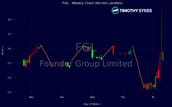
Look at the chart, not the hype. FTFT has staged a wild move on the daily timeframe. In late August, Future FinTech Group Inc. closed near $0.55. By early September, FTFT was printing highs above $3.50 and closing around $2.88. That’s a multi-hundred-percent run in a matter of days. Any ticker that makes that kind of move will draw in momentum traders, short sellers, and algos all fighting over the same order book.
The daily candles show the story clearly. FTFT traded under $1 for several sessions, then started stepping up—$1.63, $1.75, $1.82, $1.95—and suddenly exploded into the $2–$3.50 range. The wide intraday ranges and big wicks on FTFT’s chart suggest heavy churn, with traders both chasing breakouts and locking in profits fast.
Zoom in to the intraday data and it gets even more obvious. FTFT has been swinging between roughly $2.60 and $3.40 in premarket and early regular hours. Moves of $0.50–$0.70 in minutes show that Future FinTech Group Inc. is heavily day-traded, not quietly accumulated. For pattern traders, FTFT is flashing all the hallmarks of a low-priced momentum play: big volume, sharp spikes, hard pullbacks, and levels that don’t hold for long.
The tricky part is separating a one-and-done squeeze from a multi-day runner. With FTFT, recent action suggests a potential consolidation around the high-$2s to low-$3s. If that range holds, traders will be watching for a clean break over recent highs near $3.40 as the next momentum trigger. If FTFT fails and loses $2.50 with size, many short-term traders will bail, and the chart can unwind just as fast as it ramped.
Conclusion
Future FinTech Group Inc. sits in that dangerous but attractive zone where fundamentals and trading behavior diverge. On paper, FTFT has low leverage and solid working capital, yet it’s still losing money and posting negative returns on equity and assets. That combination doesn’t scream long-term stability. But for active traders, FTFT is less about long-term projections and more about the current volatility and liquidity.
The recent surge from sub-$1 levels to the $2–$3+ range has turned FTFT into a live wire. The intraday tape shows Future FinTech Group Inc. whipping around in wide ranges, which is great for day-trading if you have a plan, and brutal if you don’t. Key levels are straightforward: support interest around the mid-$2s, resistance pressure above $3.30–$3.40. FTFT slipping under those supports can accelerate selling, while a clean breakout can invite another wave of momentum traders. As millionaire penny stock trader and teacher Tim Sykes, says, “There is always another play around the corner; don’t chase just because you feel FOMO.” That mindset is especially important when FTFT is spiking or fading quickly, tempting undisciplined entries.
As Tim Sykes always says, “Volatility is opportunity, but only if you respect risk and cut losses quickly.” FTFT is a textbook example of that idea. Future FinTech Group Inc. offers plenty of action, but it’s not a safe haven. Traders studying FTFT should focus on the chart, the volume, and clear risk levels, and remember that this kind of speculative name is for disciplined trading and education—not for blind hope.
This is stock news, not investment advice. Timothy Sykes News delivers real-time stock market news focused on key catalysts driving short-term price movements. Our content is tailored for active traders and investors seeking to capitalize on rapid price fluctuations, particularly in volatile sectors like penny stocks. Readers come to us for detailed coverage on earnings reports, mergers, FDA approvals, new contracts, and unusual trading volumes that can trigger significant short-term price action. Some users utilize our news to explain sudden stock movements, while others rely on it for diligent research into potential investment opportunities.
Dive deeper into the world of trading with Timothy Sykes, renowned for his expertise in penny stocks. Explore his top picks and discover the strategies that have propelled him to success with these articles:
- Penny Stocks Trading Guide
- Best Penny Stocks Under $1 to Buy Today
- Top 8 Penny Stocks to Watch on Robinhood
Once you’ve got some stocks on watch, elevate your trading game with StocksToTrade the ultimate platform for traders. With specialized tools for swing and day trading, StocksToTrade will guide you through the market’s twists and turns.
Dig into StocksToTrade’s watchlists here:




Leave a reply