
Arrow Electronics Inc. stocks have been trading up by 7.1 percent following the most impactful strategic growth announcement.
Market Insights For ARW Traders
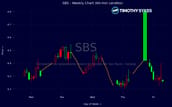
- Price has surged from the low $230s to near $248, signaling fresh buying interest after a tight consolidation.
- Intraday spike from roughly $235 to above $247 shows strong momentum and aggressive bids stepping in.
- Weekly candles now press against recent highs, putting Arrow Electronics Inc. in a potential breakout area.
- Solid revenue above $30B with modest margins supports a steady, cash-generating profile for short-term swing ideas.
- Balance sheet leverage appears controlled, giving traders some comfort on downside risk during pullbacks.

Weekly Update Sep 28 – Oct 02, 2026: On Sunday, October 04, 2026 Arrow Electronics Inc. stock [NYSE: ARW] is trending up by 7.1%! Discover the key drivers behind this movement as well as our expert analysis in the detailed breakdown below.
Technology industry expert:
Analyst sentiment – positive
Arrow Electronics (ARW) is a scale leader in global electronic components distribution, with $30.9B in revenue and a lean 11.3% gross margin characteristic of the sector. Profitability is solid for a distributor: EBIT margin 3.4%, net margin 2.3%, ROE 12–15%, and ROIC ~8–12% indicate disciplined capital allocation. Valuation is undemanding at 0.34x sales, 1.76x book, and ~15.5x earnings, while leverage is moderate (total debt/equity 0.31, interest coverage 7.4x). Operating cash flow and quarterly free cash flow of ~$297M comfortably cover capex and buybacks, supporting value-creation via repurchases rather than dividends.
Technically, ARW is in a strong short-term uptrend following a sharp breakout. The stock moved from 227 to 248.08 in a few sessions, with sequential closes at 227, 231.63, and 248.08, indicating aggressive bid pressure and likely elevated breakout volume versus prior weeks. Intraday 5-minute candles show persistent buying on dips and limited downside follow-through, consistent with institutional accumulation. The key actionable level is $231–233; that prior resistance now serves as first major support and a logical risk anchor for new long entries.
With no significant new fundamental news, the story is driven by normalization in the components cycle and relative valuation versus Technology and Hardware & Equipment peers, where ARW trades at a discount on P/E and EV/sales despite comparable ROIC. Near term, I expect mean re-rating as investors seek cash-generative cyclicals with manageable leverage. Support sits at $231 and then $227; initial resistance is $250, with a 6–12 month upside target range of $265–275 assuming stable margins and modest revenue growth.
More Breaking News
Quick Financial Overview
Arrow Electronics Inc. (ARW) is printing strong top-line numbers, with revenue around $30.85B and revenue per share above $600. Margins are thin but typical for a large distributor, with gross margin near 11% and profit margin just above 2%. For traders, that combination often means the market cares more about execution and cycle swings than long-term story lines.
Valuation is moderate, with a P/E near 15.5 and price-to-sales around 0.34, which keeps expectations in check. Price-to-book is under 2, while price-to-free-cash-flow is under 10, suggesting the stock is not priced for perfection. Returns on equity in the low to mid-teens and solid returns on capital show ARW is turning its asset base efficiently.
On the balance sheet, total debt to equity of about 0.31 and interest coverage above 7 indicate manageable leverage. Liquidity ratios around 1–1.2 show Arrow Electronics Inc. is running lean but not stretched. Cash flow is a bright spot, with recent free cash flow near $297M against meaningful share repurchases and debt paydown, which can quietly support the stock during market dips.
Conclusion
This is stock news, not investment advice. Timothy Sykes News delivers real-time stock market news focused on key catalysts driving short-term price movements. Our content is tailored for active traders and investors seeking to capitalize on rapid price fluctuations, particularly in volatile sectors like penny stocks. Readers come to us for detailed coverage on earnings reports, mergers, FDA approvals, new contracts, and unusual trading volumes that can trigger significant short-term price action. Some users utilize our news to explain sudden stock movements, while others rely on it for diligent research into potential investment opportunities.
Dive deeper into the world of trading with Timothy Sykes, renowned for his expertise in penny stocks. Explore his top picks and discover the strategies that have propelled him to success with these articles:
- Penny Stocks Trading Guide
- Best Penny Stocks Under $1 to Buy Today
- Top 8 Penny Stocks to Watch on Robinhood
Once you’ve got some stocks on watch, elevate your trading game with StocksToTrade the ultimate platform for traders. With specialized tools for swing and day trading, StocksToTrade will guide you through the market’s twists and turns.
Dig into StocksToTrade’s watchlists here:




Leave a reply