timothy sykes logo

Watchlists-Penny Stock Investment Strategy

3 Stocks To Keep An Eye On Today šŸ‘€

Timothy SykesAvatar
Written by Timothy Sykes
Updated 11/17/2023 6 min read

Friday the market was on fire with stocks soaring more than 200%!

The opportunity for any trader with a small account keeps growing…

And if you want to know how to take advantage of what we’re seeing…

You need to pay attention! 

Every day I have a list of stocks I’m closely watching…

And today, there are three stocks I’m keeping a very close eye on.

Want to know what they are?

Keep reading to find out!

Stock #1 – WaveDancer, Inc. (NASDAQ: WAVD)

Back on November 10th, WAVD was trading around $1.20 per share…

And at the time I’m writing this, it’s trading at $2.80 per share.

That’s over a 133% gain in just a few days!

Take a look at the chart.

Source: StocksToTrade

Perhaps some of you are curious about the cause of this sudden increase and what steps you could’ve taken to spot it earlier.

WAVD illustrates a classic short squeeze, but there are ways YOU can identify these stocks ahead of time…

And I’ll get to that in just a few minutes.

WAVD is a multiday runner, and if you understand my 7-Step PennyStock Framework, you already know what goes up must come down.

I’m not looking to chase WAVD higher, and on Friday it did have a small morning panic…

But these types of plays can fall just as fast as they spike, so I’ll be looking for volume to return and for a bigger morning panic to take advantage of.

Stock#2 – Safety Shot, Inc. (NASDAQ: SHOT)

On November 1st, SHOT was trading at roughly $1.20 a share…

It’s now trading at $3.01 at the time I’m writing this and that’s over a 150% move!

Just take a look at this chart…

Source: StocksToTrade

Take a look at where I drew the white line…

That line illustrates the point where SHOT broke out of a key multi-month resistance area and once it did that, it was off to the races.

If you want to learn more about support and resistance, here’s an old but good video I made years ago.
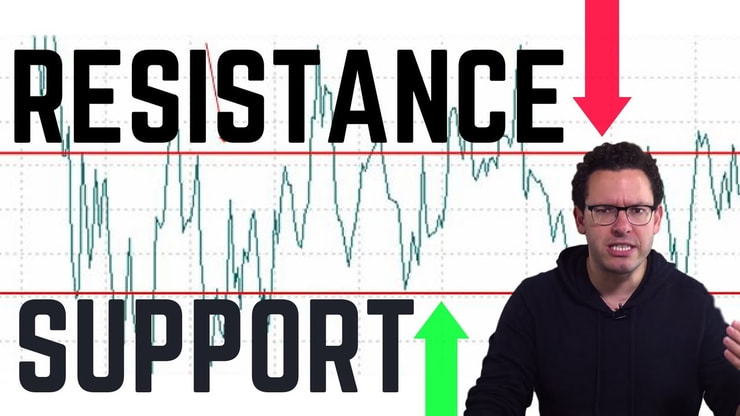
Identifying key support and resistance areas can help traders better understand when to buy or sell.

You don’t want to buy a stock that’s approaching a key resistance area.

Let me show you another chart to help give you a better idea.

Source: StocksToTrade

This is a yearly chart on SHOT, and this is why I always look at multiple timeframes to help me better understand what the ā€œbigā€ picture is.

Most newbies would’ve seen SHOT spiking higher from the first chart and get FOMO and want to simply buy it.

Honestly, that’s dangerous for any trader to do.

It’s already overextended and it’s starting to approach a key multiyear resistance area, and knowing how much it’s already spiked in the last couple of days…

I’m not looking to buy it, instead, I’ll be patiently waiting for it to panic.

More Breaking News

SHOT is being traded like a promoter stock, so if it is promoted and does panic, promoters will likely try to save it and help it bounce back.

Stock #3 – Altamira Therapeutics Ltd. (NASDAQ: CYTO)

On November 16th, CYTO was trading at roughly $0.10….

And at the time I’m writing this, it’s trading at $0.35…

That’s over a 240% increase!

Just take a look at this move…

Source: StocksToTrade Breaking News

Earlier I mentioned what traders could do differently to spot some of these most explosive moves before they happen.

On Friday morning, StocksToTrade Breaking News alerted traders pre-market about CYTO and since then, it’s been off to the races soaring more than 300%!

News catalysts have been red hot for these small-cap stocks as of late, and when you have a stock that is so beaten down like CYTO…

Plus knowing how over-aggressive these short sellers are, and you factor in a news catalyst…

That’s where you’ll come across some amazing opportunities.

At this point, I’m not looking to chase it higher…

I’ll be waiting to see if there is a solid morning or intraday panic for me to take advantage of.

Take a look at this chart below…

Source: StocksToTrade

At the time I’m writing this, CYTO has already been batted down at that monthly resistance level of around $0.45…

But there’s always the possibility it could trap more short sellers and send it higher.

You never know what the market is going to do, that’s why it’s so critical to be prepared for every day you trade.

Before we go today, I have one thing to ask all of you…

How badly do you want to succeed at trading? 

Success is built around understanding how this market works and having the right tools.

These three stocks are going to be on the top of my list for today…

But there are plenty more that I’ll be keeping a close eye on…

Click here to see what other top stocks I’m watching! 


I want all of you to be successful…

So as we get ready to kick start another week, be sure to see what many of my millionaire students are noticing in this market and what their plan is!

šŸ‘‰Click here for your FREE spot in this week’s trading session! šŸ‘ˆ

-Tim


How much has this post helped you?


Leave a reply

Author card Timothy Sykes picture

Timothy Sykes

Tim Sykes is a penny stock trader and teacher who became a self-made millionaire by the age of 22 by trading $12,415 of bar mitzvah money. After becoming disenchanted with the hedge fund world, he established the Tim Sykes Trading Challenge to teach aspiring traders how to follow his trading strategies. He’s been featured in a variety of media outlets including CNN, Larry King, Steve Harvey, Forbes, Men’s Journal, and more. He’s also an active philanthropist and environmental activist, a co-founder of Karmagawa, and has donated millions of dollars to charity.
Read More

* Results are not typical and will vary from person to person. Making money trading stocks takes time, dedication, and hard work. There are inherent risks involved with investing in the stock market, including the loss of your investment. Past performance in the market is not indicative of future results. Any investment is at your own risk. See Terms of Service here

The available research on day trading suggests that most active traders lose money. Fees and overtrading are major contributors to these losses.

A 2000 study called ā€œTrading is Hazardous to Your Wealth: The Common Stock Investment Performance of Individual Investorsā€ evaluated 66,465 U.S. households that held stocks from 1991 to 1996. The households that traded most averaged an 11.4% annual return during a period where the overall market gained 17.9%. These lower returns were attributed to overconfidence.

A 2014 paper (revised 2019) titled ā€œLearning Fast or Slow?ā€ analyzed the complete transaction history of the Taiwan Stock Exchange between 1992 and 2006. It looked at the ongoing performance of day traders in this sample, and found that 97% of day traders can expect to lose money from trading, and more than 90% of all day trading volume can be traced to investors who predictably lose money. Additionally, it tied the behavior of gamblers and drivers who get more speeding tickets to overtrading, and cited studies showing that legalized gambling has an inverse effect on trading volume.

A 2019 research study (revised 2020) called ā€œDay Trading for a Living?ā€ observed 19,646 Brazilian futures contract traders who started day trading from 2013 to 2015, and recorded two years of their trading activity. The study authors found that 97% of traders with more than 300 days actively trading lost money, and only 1.1% earned more than the Brazilian minimum wage ($16 USD per day). They hypothesized that the greater returns shown in previous studies did not differentiate between frequent day traders and those who traded rarely, and that more frequent trading activity decreases the chance of profitability.

These studies show the wide variance of the available data on day trading profitability. One thing that seems clear from the research is that most day traders lose money .

Millionaire Media 66 W Flagler St. Ste. 900 Miami, FL 33130 United States (888) 878-3621 This is for information purposes only as Millionaire Media LLC nor Timothy Sykes is registered as a securities broker-dealer or an investment adviser. No information herein is intended as securities brokerage, investment, tax, accounting or legal advice, as an offer or solicitation of an offer to sell or buy, or as an endorsement, recommendation or sponsorship of any company, security or fund. Millionaire Media LLC and Timothy Sykes cannot and does not assess, verify or guarantee the adequacy, accuracy or completeness of any information, the suitability or profitability of any particular investment, or the potential value of any investment or informational source. The reader bears responsibility for his/her own investment research and decisions, should seek the advice of a qualified securities professional before making any investment, and investigate and fully understand any and all risks before investing. Millionaire Media LLC and Timothy Sykes in no way warrants the solvency, financial condition, or investment advisability of any of the securities mentioned in communications or websites. In addition, Millionaire Media LLC and Timothy Sykes accepts no liability whatsoever for any direct or consequential loss arising from any use of this information. This information is not intended to be used as the sole basis of any investment decision, nor should it be construed as advice designed to meet the investment needs of any particular investor. Past performance is not necessarily indicative of future returns.

Citations for Disclaimer

Barber, Brad M. and Odean, Terrance, Trading is Hazardous to Your Wealth: The Common Stock Investment Performance of Individual Investors. Available at SSRN: ā€œDay Trading for a Living?ā€

Barber, Brad M. and Lee, Yi-Tsung and Liu, Yu-Jane and Odean, Terrance and Zhang, Ke, Learning Fast or Slow? (May 28, 2019). Forthcoming: Review of Asset Pricing Studies, Available at SSRN: ā€œhttps://ssrn.com/abstract=2535636ā€

Chague, Fernando and De-Losso, Rodrigo and Giovannetti, Bruno, Day Trading for a Living? (June 11, 2020). Available at SSRN: ā€œhttps://ssrn.com/abstract=3423101ā€