Daily Trade Ideas From Millionaire Traders
Learn the Formula From These Top Penny Stock Trading Experts

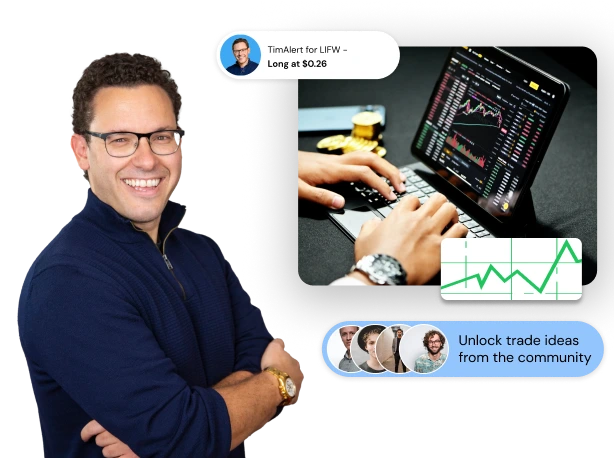
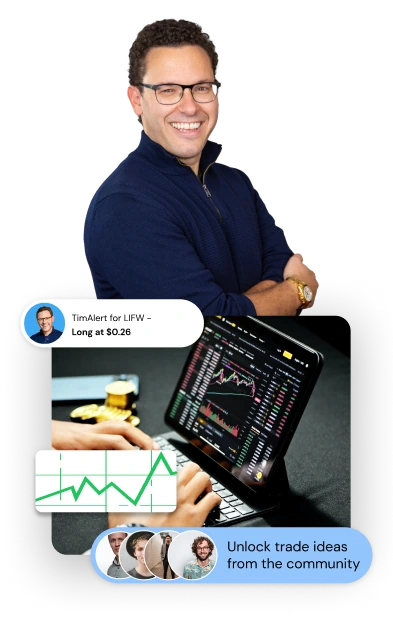
TimAlert for LIFW -
Long at $0.26

Unlock trade ideas
from the community

Most traders lose money.
That's because they trade without a plan.
They don't know how to pick the right entries and exits.
They don't know which stocks to trade.
They don't know how to avoid going head to head with Wall Street.
I'm Tim Sykes, a penny stock trader with $7.5 million in documented earnings over 20-plus years.
My Trading Challenge has seen over 30 students become millionaire traders, and countless others find community and expert guidance.
Watch my FREE Webinar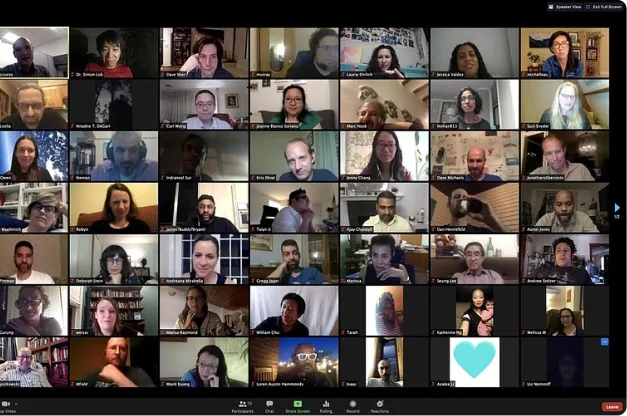

9,000+ Video Lessons
They don't know which stocks to trade.
Daily Watchlist
My Trading Challenge students receive my exclusive daily watchlist.
Challenge Chat Room
We've got the best chat room on the planet!
Interactive Webinars
Get personal guidance from me and several of my top students.
How My Top Students Became Millionaires

Mariana Hincapie. She became my youngest millionaire student at the age of 20!
Read Mariana's story here
Jack Kellogg. Jack was working as a valet in 2017 - now he's up more than $12 million!
Read Jack's story here
Tim Grittani. Tim became my most profitable student ever by mastering short selling.
Read Tim's story here
Mark Croock. Mark adapted my penny stock strategies for options trading.
Read Mark's story here
Start Learning Now with My FREE Trading Guides
In the past 10 years, over 16,000 students have taken the Trading Challenge
Join our live webinar: The Millionaire Trader’s Formula
Right now, something Tim calls a “profit window” is opening up – and taking place in a sector of the market few traders know ANYTHING about… Join Tim Sykes and his millionaire students for weekly strategy sessions to see how traders are already taking advantage!


Apply to Join My Trading Challenge
We only take students willing to study hard and be a contributing member to our great community. Think you've got what it takes?
This is where every one of 31 millionaire students started...

Timothy Sykes on Youtube


Timothy Sykes
@timothysykes
I've turned $12k into $7.5 million trading stocks from 132 countries/building 115 schools, go apply at tim.ly/sykeschallenge to be my dedicated student!
Ready to take action?
Sign up to our millionaire traders' FREE watchlist and start seeing the opportunities they see every day!
* Results are not typical and will vary from person to person. Making money trading stocks takes time, dedication, and hard work. There are inherent risks involved with investing in the stock market, including the loss of your investment. Past performance in the market is not indicative of future results. Any investment is at your own risk. See Terms of Service here
The available research on day trading suggests that most active traders lose money. Fees and overtrading are major contributors to these losses.
A 2000 study called “Trading is Hazardous to Your Wealth: The Common Stock Investment Performance of Individual Investors” evaluated 66,465 U.S. households that held stocks from 1991 to 1996. The households that traded most averaged an 11.4% annual return during a period where the overall market gained 17.9%. These lower returns were attributed to overconfidence.
A 2014 paper (revised 2019) titled “Learning Fast or Slow?” analyzed the complete transaction history of the Taiwan Stock Exchange between 1992 and 2006. It looked at the ongoing performance of day traders in this sample, and found that 97% of day traders can expect to lose money from trading, and more than 90% of all day trading volume can be traced to investors who predictably lose money. Additionally, it tied the behavior of gamblers and drivers who get more speeding tickets to overtrading, and cited studies showing that legalized gambling has an inverse effect on trading volume.
A 2019 research study (revised 2020) called “Day Trading for a Living?” observed 19,646 Brazilian futures contract traders who started day trading from 2013 to 2015, and recorded two years of their trading activity. The study authors found that 97% of traders with more than 300 days actively trading lost money, and only 1.1% earned more than the Brazilian minimum wage ($16 USD per day). They hypothesized that the greater returns shown in previous studies did not differentiate between frequent day traders and those who traded rarely, and that more frequent trading activity decreases the chance of profitability.
These studies show the wide variance of the available data on day trading profitability. One thing that seems clear from the research is that most day traders lose money .
Millionaire Media 66 W Flagler St. Ste. 900 Miami, FL 33130 United States (888) 878-3621 This is for information purposes only as Millionaire Media LLC nor Timothy Sykes is registered as a securities broker-dealer or an investment adviser. No information herein is intended as securities brokerage, investment, tax, accounting or legal advice, as an offer or solicitation of an offer to sell or buy, or as an endorsement, recommendation or sponsorship of any company, security or fund. Millionaire Media LLC and Timothy Sykes cannot and does not assess, verify or guarantee the adequacy, accuracy or completeness of any information, the suitability or profitability of any particular investment, or the potential value of any investment or informational source. The reader bears responsibility for his/her own investment research and decisions, should seek the advice of a qualified securities professional before making any investment, and investigate and fully understand any and all risks before investing. Millionaire Media LLC and Timothy Sykes in no way warrants the solvency, financial condition, or investment advisability of any of the securities mentioned in communications or websites. In addition, Millionaire Media LLC and Timothy Sykes accepts no liability whatsoever for any direct or consequential loss arising from any use of this information. This information is not intended to be used as the sole basis of any investment decision, nor should it be construed as advice designed to meet the investment needs of any particular investor. Past performance is not necessarily indicative of future returns.
Citations for Disclaimer
Barber, Brad M. and Odean, Terrance, Trading is Hazardous to Your Wealth: The Common Stock Investment Performance of Individual Investors. Available at SSRN: “Day Trading for a Living?”
Barber, Brad M. and Lee, Yi-Tsung and Liu, Yu-Jane and Odean, Terrance and Zhang, Ke, Learning Fast or Slow? (May 28, 2019). Forthcoming: Review of Asset Pricing Studies, Available at SSRN: “https://ssrn.com/abstract=2535636”
Chague, Fernando and De-Losso, Rodrigo and Giovannetti, Bruno, Day Trading for a Living? (June 11, 2020). Available at SSRN: “https://ssrn.com/abstract=3423101”